Related Images


Download:
| Tiny | 130x128 | View | Download |
| Small | 261x256 | View | Download |
| Medium | 522x512 | View | Download |
| Original | 1024x1003 | View | Download |
This image was acquired from
wikimedia. It was marked as Public Domain or CC0 and is free to use. To verify, go to the source and check the information there.
Looking for more info about this image?
Try a Google Reverse Image Search for it.
Try a Google Reverse Image Search for it.
Keywords from Image Description:
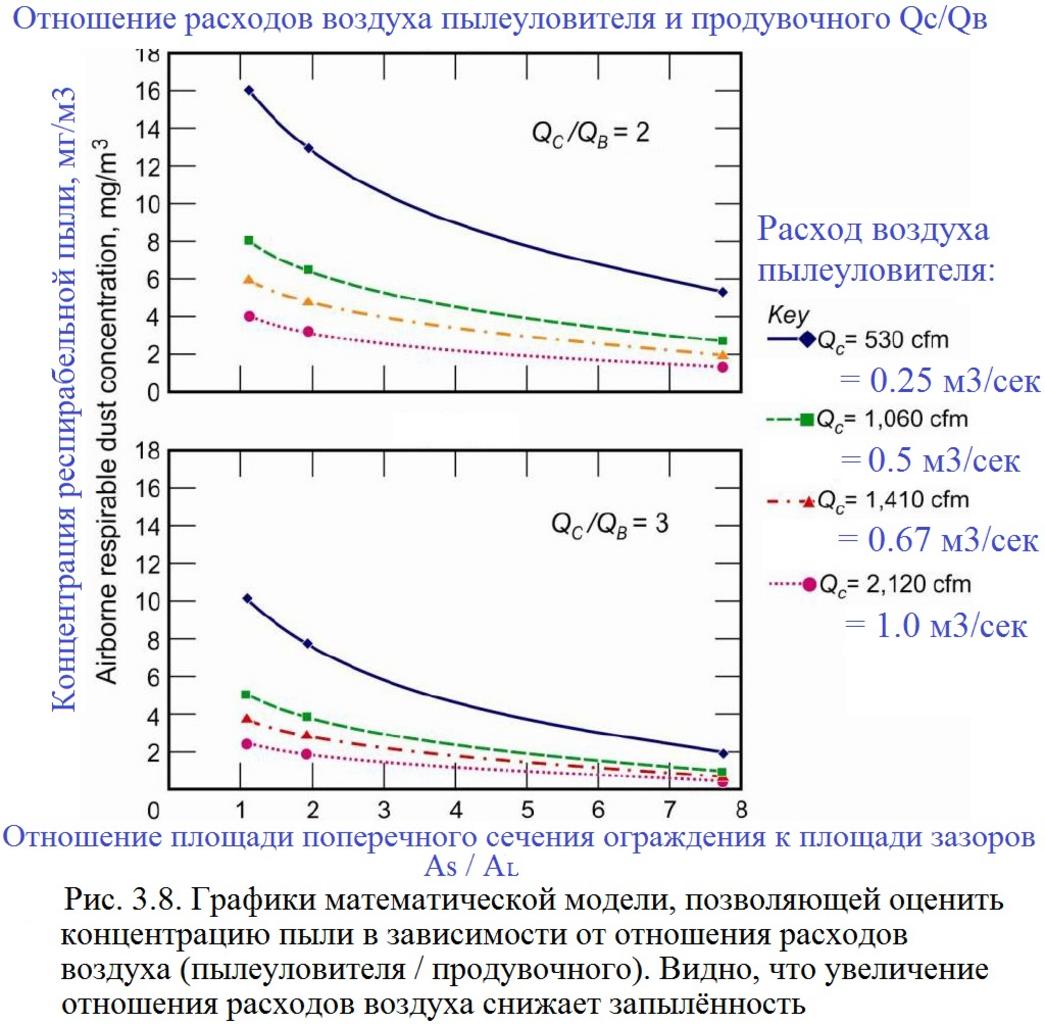
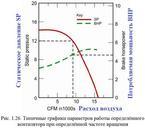
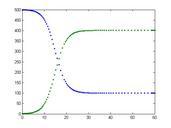
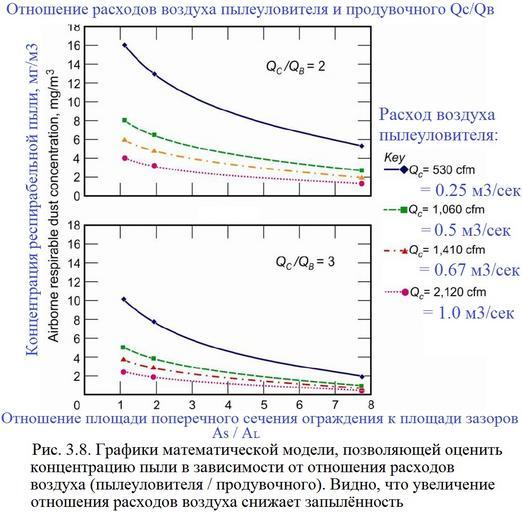
. .. . ru en Figure Graphs of the model that represents the severity of dust emissions based upon collector to bailing airflow ratios showing that the respirable dust concentrations become lower as the collector to bailing airflow ratio increases cdc gov html Dust Control