Download:
| Tiny | 189x128 | View | Download |
| Small | 379x256 | View | Download |
| Original png | 661x446 | View | Download |
| Original as jpg | 661x446 | View | Download |
This image was acquired from
wikimedia. It was marked as Public Domain or CC0 and is free to use. To verify, go to the source and check the information there.
Looking for more info about this image?
Try a Google Reverse Image Search for it.
Try a Google Reverse Image Search for it.
Keywords from Image Description:
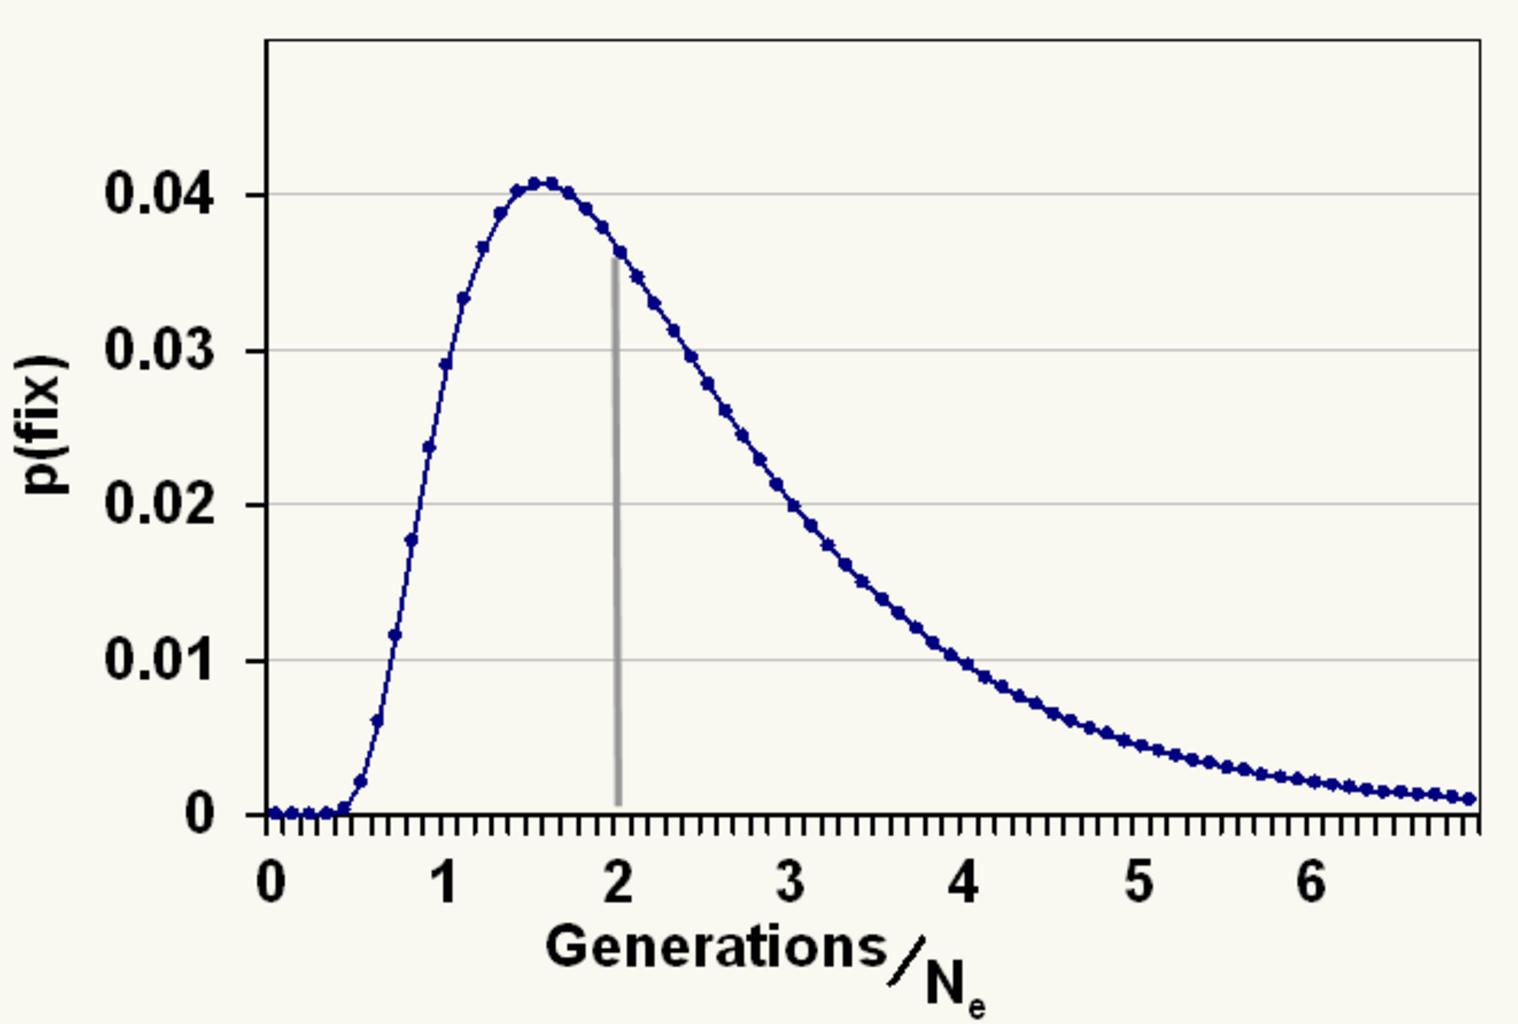
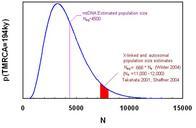
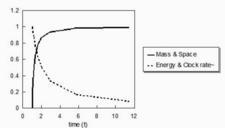
Nrule. en Probability of fixation versus generation time size The diagram is based on outcomes per haploid locus passage of or alleles at frequency of and frequencies respectively Generations used for the example and median fixation time in generations was generations following the rule see coalesence theory the plot
