
Related Images


Download:
| Tiny | 262x128 | View | Download |
| Small | 524x256 | View | Download |
| Medium | 1049x512 | View | Download |
| Large | 2098x1024 | View | Download |
| Original png | 2349x1146 | View | Download |
| Original as jpg | 2349x1146 | View | Download |
This image was acquired from
wikimedia. It was marked as Public Domain or CC0 and is free to use. To verify, go to the source and check the information there.
Looking for more info about this image?
Try a Google Reverse Image Search for it.
Try a Google Reverse Image Search for it.
Keywords from Image Description:
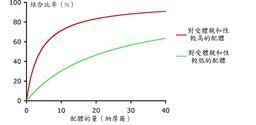
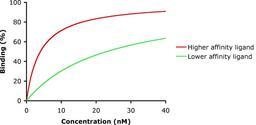
Agonists v. en plot of the proportion of receptors bound with two different agonists at varying agonist concentrations In this plot higher affinity agonist red and lower affinity agonist are compared Classical binding to the receptors with Michaelis Menten kinetics has been assumed This plot is in linearlinear coordinates On loglinear