
Related Images


Download:
| Tiny | 224x128 | View | Download |
| Small | 448x256 | View | Download |
| Medium | 896x512 | View | Download |
| Original png | 1260x720 | View | Download |
| Original as jpg | 1260x720 | View | Download |
This image was acquired from
wikimedia. It was marked as Public Domain or CC0 and is free to use. To verify, go to the source and check the information there.
Looking for more info about this image?
Try a Google Reverse Image Search for it.
Try a Google Reverse Image Search for it.
Keywords from Image Description:
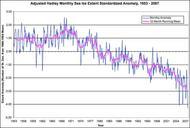
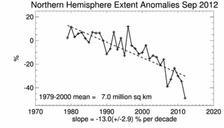
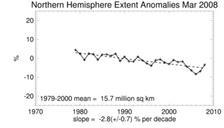
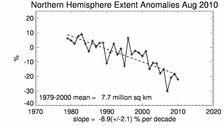
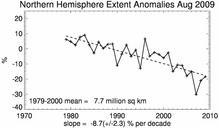
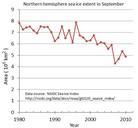
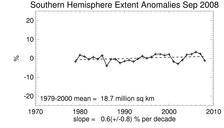
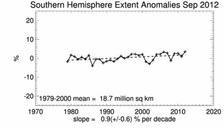
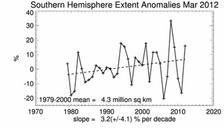
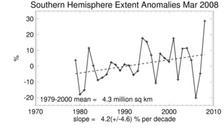
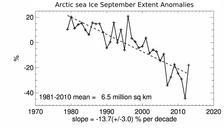
Arctic sea Ice September Extent Anomalies. en This graph shows monthly ice extent anomalies plotted as time series of percent difference between the extent for the month in question and the mean for that month based on the January to December data The anomaly data points are plotted as plus signs and the trend line is plotted with