Related Images


Download:
| Tiny | 148x128 | View | Download |
| Small | 297x256 | View | Download |
| Medium | 594x512 | View | Download |
| Original png | 670x577 | View | Download |
| Original as jpg | 670x577 | View | Download |
This image was acquired from
wikimedia. It was marked as Public Domain or CC0 and is free to use. To verify, go to the source and check the information there.
Looking for more info about this image?
Try a Google Reverse Image Search for it.
Try a Google Reverse Image Search for it.
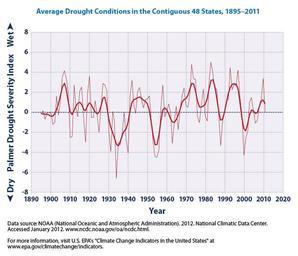
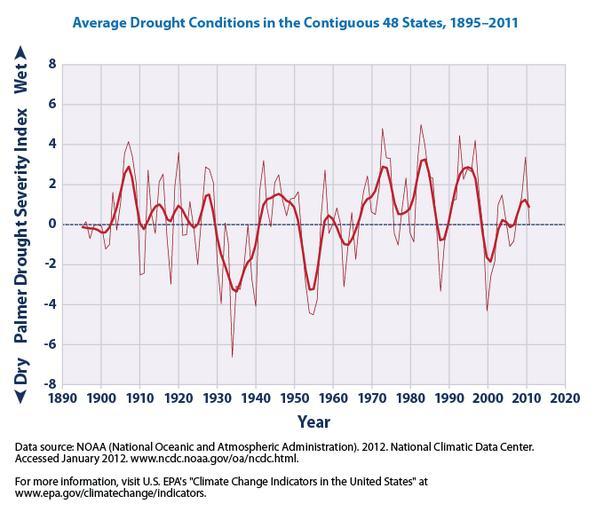
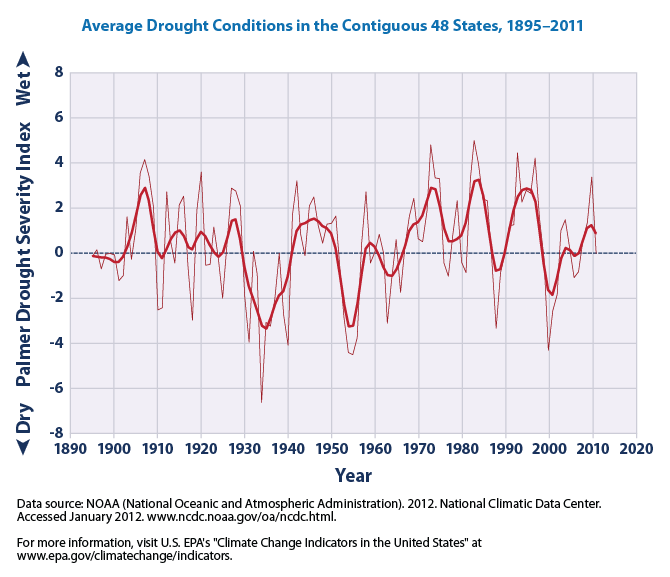
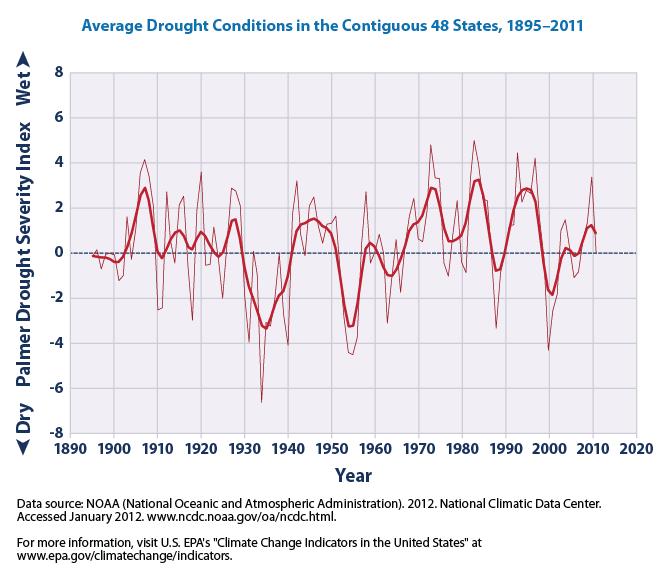
Keywords from Image Description:
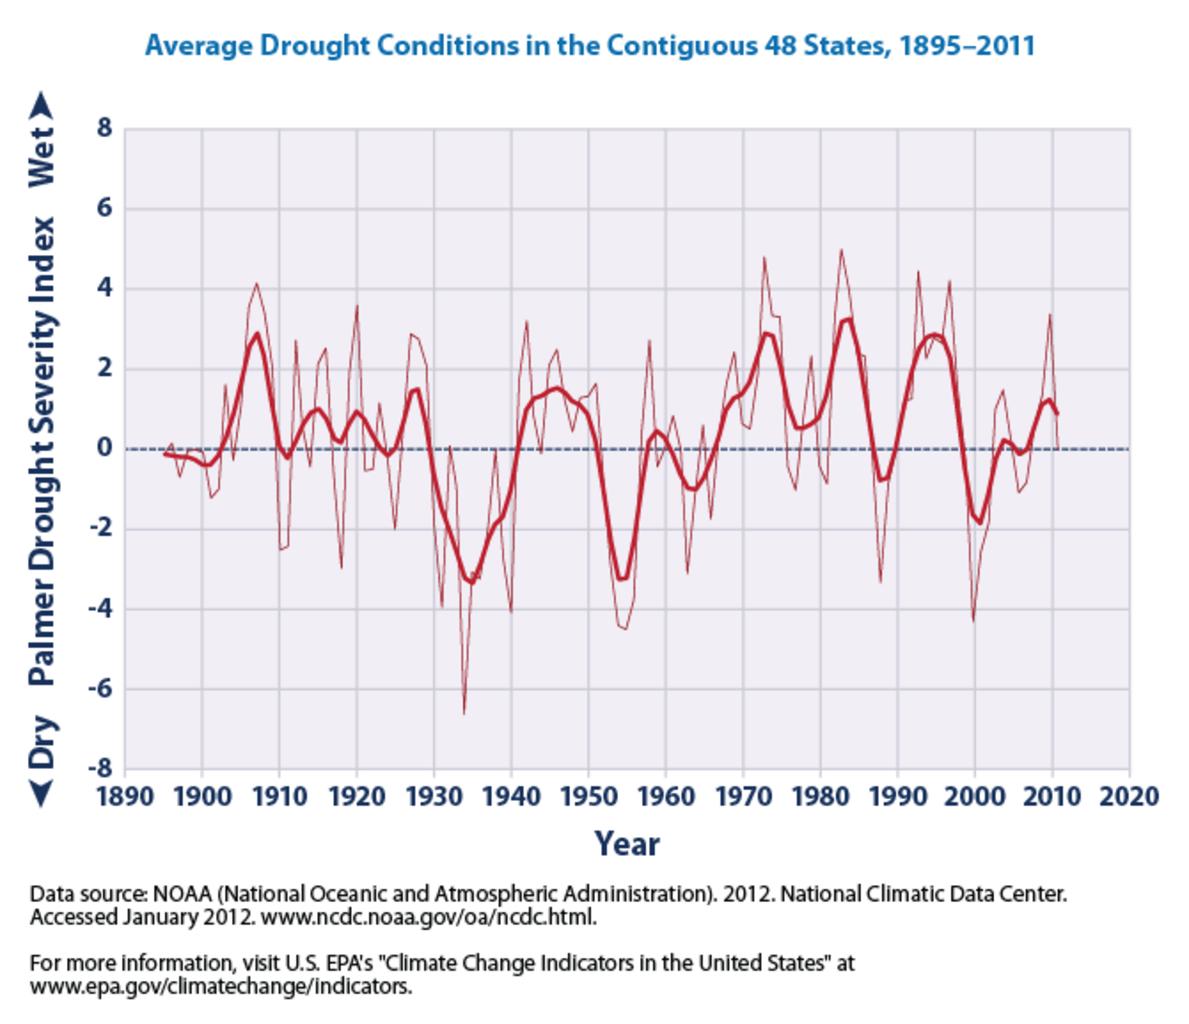
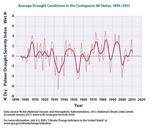
Average Drought Conditions in the Contiguous States . en This graph shows average drought conditions in the contiguous states according to the EPA with yearly data going from to As stated by the agency value between and indicates moderate drought to is severe drought and or below indicates extreme drought The curve is nineyear