
Related Images


Download:
| Tiny | 233x128 | View | Download |
| Small | 467x256 | View | Download |
| Medium | 934x512 | View | Download |
| Original png | 986x540 | View | Download |
| Original as jpg | 986x540 | View | Download |
This image was acquired from
wikimedia. It was marked as Public Domain or CC0 and is free to use. To verify, go to the source and check the information there.
Looking for more info about this image?
Try a Google Reverse Image Search for it.
Try a Google Reverse Image Search for it.
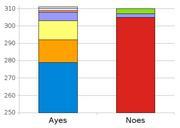
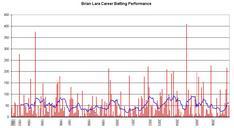
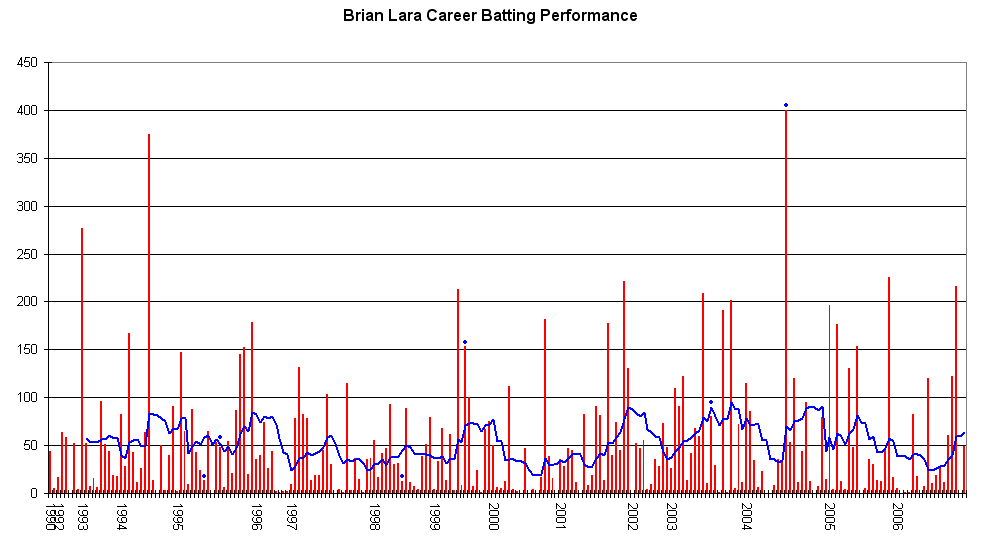
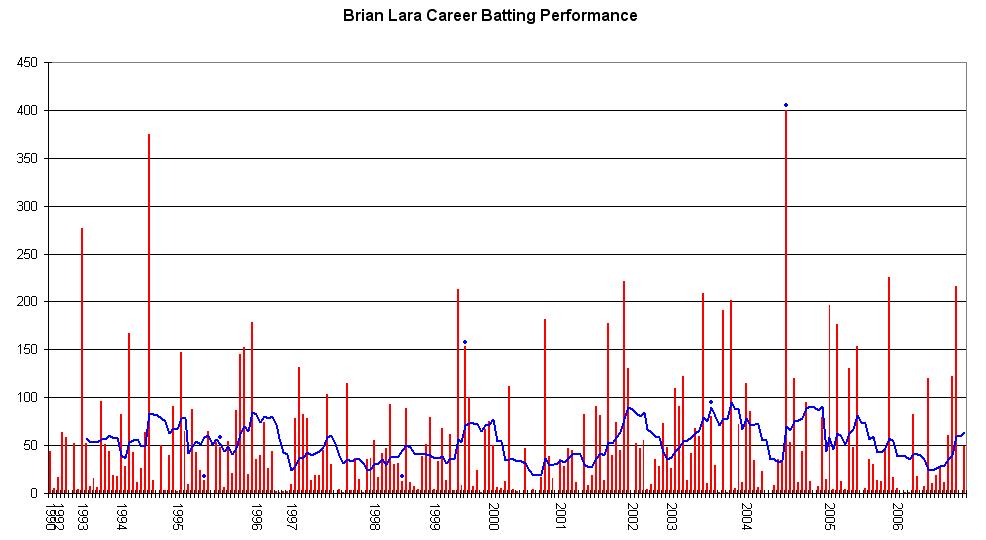
Keywords from Image Description:
Brian Lara Graph. Test Match performance of Brian Lara The red bars indicate the player's test match innings while the blue line shows the average of the ten most recent innings at that point Note that this average cannot be calculated for the first nine innings The blue dots indicate innings in which Lara finished notout This graph