
Related Images

Download:
| Tiny | 151x128 | View | Download |
| Small | 303x256 | View | Download |
| Medium | 607x512 | View | Download |
| Original svg | 726x612 | View | Download |
| Original as jpg | 726x612 | View | Download |
This image was acquired from
wikimedia. It was marked as Public Domain or CC0 and is free to use. To verify, go to the source and check the information there.
Looking for more info about this image?
Try a Google Reverse Image Search for it.
Try a Google Reverse Image Search for it.
Keywords from Image Description:
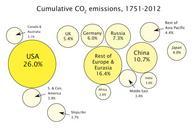
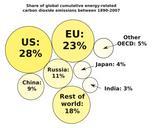
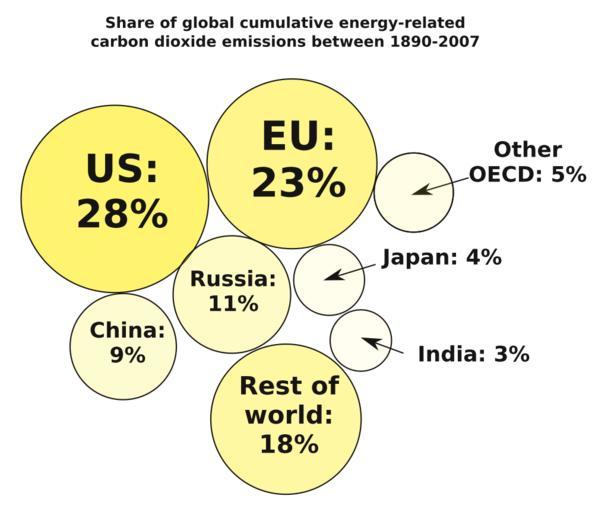
Bubble diagram showing the share of global cumulative energyrelated carbon dioxide emissions for major emitters between .svg carbon dioxide emissions between Major emitters are shown percentage share in brackets the United States the European Union Russia China other OECD countries Japan India and the rest of the world Data