
Related Images


Download:
| Tiny | 227x128 | View | Download |
| Original png | 389x219 | View | Download |
| Original as jpg | 389x219 | View | Download |
This image was acquired from
wikimedia. It was marked as Public Domain or CC0 and is free to use. To verify, go to the source and check the information there.
Looking for more info about this image?
Try a Google Reverse Image Search for it.
Try a Google Reverse Image Search for it.
Keywords from Image Description:
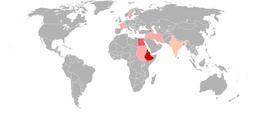
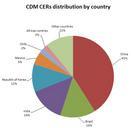
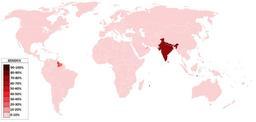
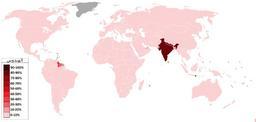
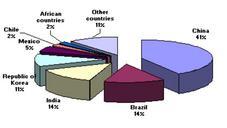
CDM CERs distribution by country. The chart shows the emission reductions CER's expected from CDM projects by country in which the emissions were reduced Original title expected average annual CERs from registered projects by host party Total Note it concerns projects that are already registered but because the projects are ongoing