
Related Images


Download:
| Tiny | 169x128 | View | Download |
| Small | 339x256 | View | Download |
| Medium | 679x512 | View | Download |
| Large | 1359x1024 | View | Download |
| Original png | 2318x1746 | View | Download |
| Original as jpg | 2318x1746 | View | Download |
This image was acquired from
wikimedia. It was marked as Public Domain or CC0 and is free to use. To verify, go to the source and check the information there.
Looking for more info about this image?
Try a Google Reverse Image Search for it.
Try a Google Reverse Image Search for it.
Keywords from Image Description:
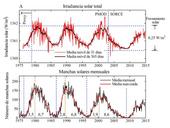
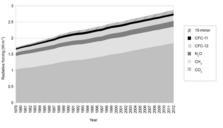
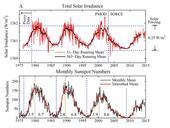
Changes in total solar irradiance and monthly sunspot numbers . total solar irradiance TSI labelled and monthly sunspot numbers between approximately to TSI is measured in watts per square metre Graph plots monthly mean and smoothed mean with the monthly mean showing more variability than the smoothed mean The pattern of peaks