Download:
| Tiny | 153x128 | View | Download |
| Small | 307x256 | View | Download |
| Original png | 460x383 | View | Download |
| Original as jpg | 460x383 | View | Download |
This image was acquired from
wikimedia. It was marked as Public Domain or CC0 and is free to use. To verify, go to the source and check the information there.
Looking for more info about this image?
Try a Google Reverse Image Search for it.
Try a Google Reverse Image Search for it.
Keywords from Image Description:
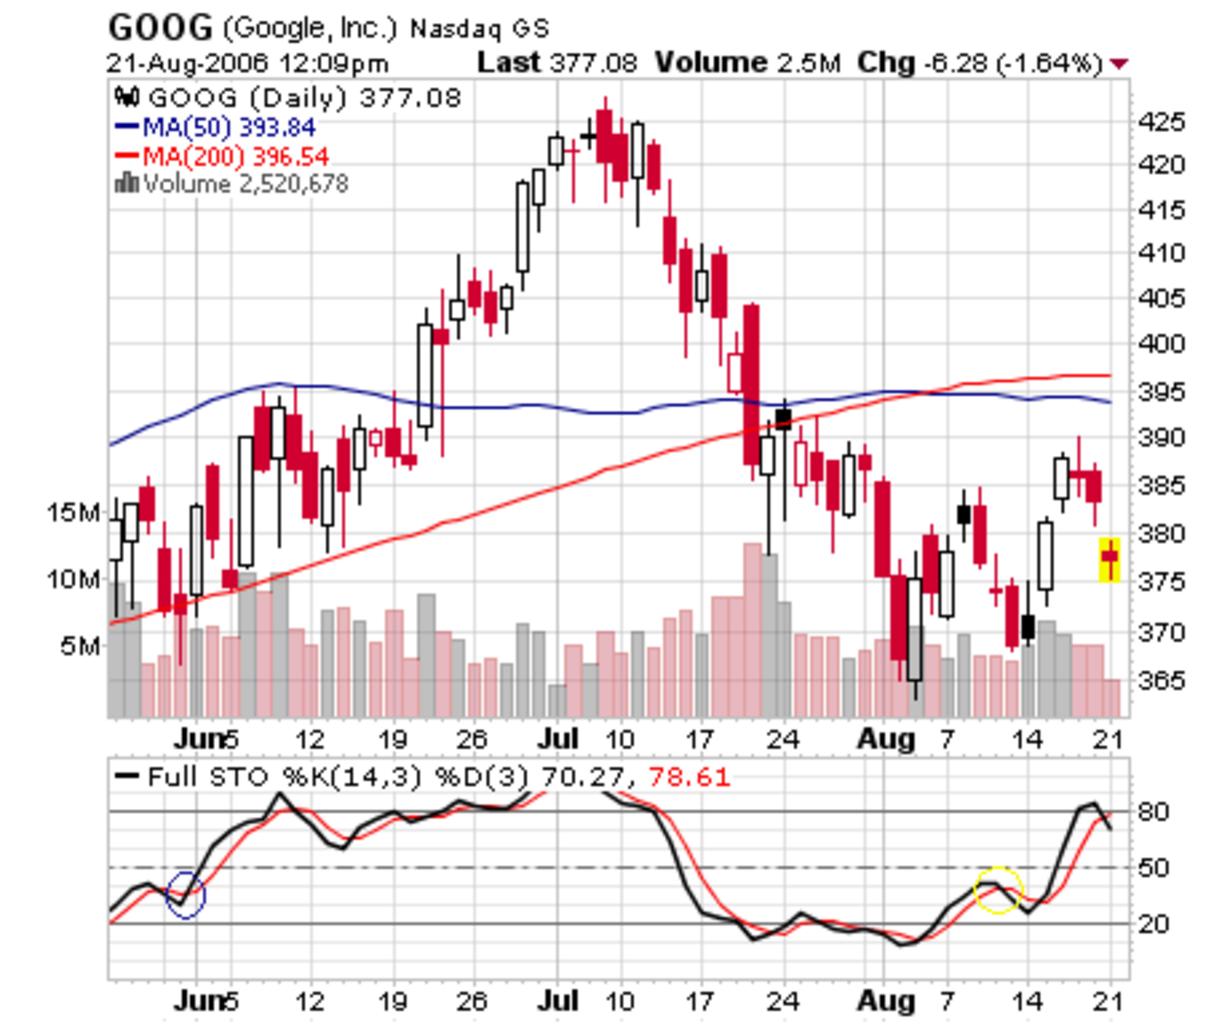
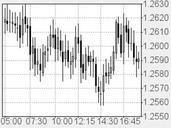
Chart Goog. Chart de la accin bursatil de la empresa Google cotizada en Nasdaq En su parte inferior presenta el grfico del Oscilador Estocstico sealando con azul cuando corta su media movil en forma ascendente con amarillo cuando lo hace en forma descendente own assumed Booksboy Google Technical analysis Share price trends
