
Related Images


Download:
| Tiny | 150x128 | View | Download |
| Small | 301x256 | View | Download |
| Medium | 602x512 | View | Download |
| Original | 703x597 | View | Download |
This image was acquired from
wikimedia. It was marked as Public Domain or CC0 and is free to use. To verify, go to the source and check the information there.
Looking for more info about this image?
Try a Google Reverse Image Search for it.
Try a Google Reverse Image Search for it.
Keywords from Image Description:
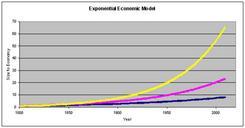
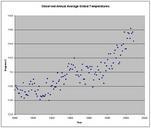
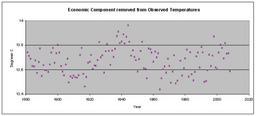
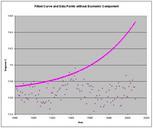
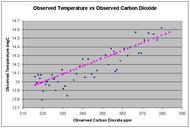
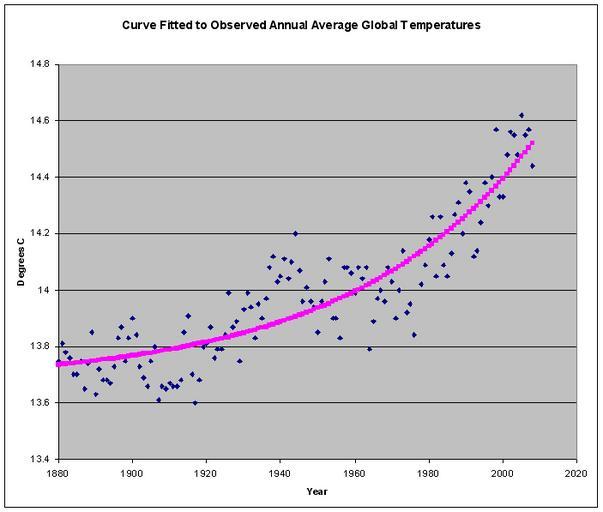
CNH Figure . Regression curve fitted to the scatter plot of annual average global temperatures from NASA using the growth of the exponential economy model since AD as the basis for the increase in temperatures Own Conhegarty Scatterplots Line charts Diagrams in English