Download:
| Tiny | 170x128 | View | Download |
| Small | 341x256 | View | Download |
| Medium | 682x512 | View | Download |
| Original png | 1200x900 | View | Download |
| Original as jpg | 1200x900 | View | Download |
This image was acquired from
wikimedia. It was marked as Public Domain or CC0 and is free to use. To verify, go to the source and check the information there.
Looking for more info about this image?
Try a Google Reverse Image Search for it.
Try a Google Reverse Image Search for it.
Keywords from Image Description:
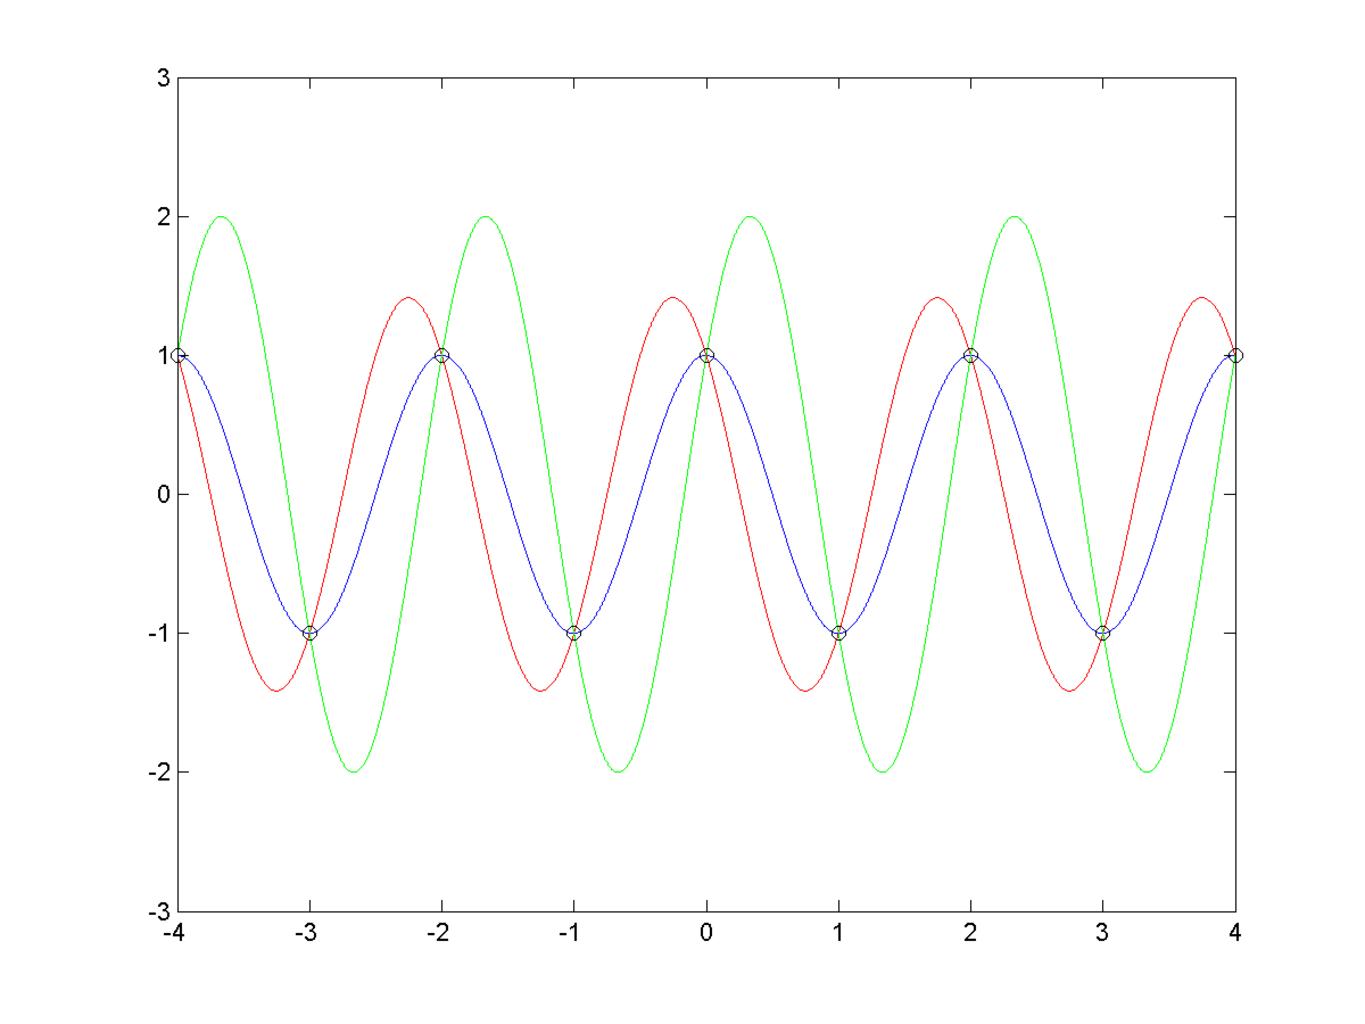
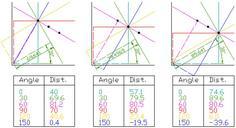
CriticalFrequencyAliasing. This shows three different sinusoids all at precisely the Nyquist frequency or critical frequency and how the samples do not provide enough information to differentiate between them My script Randy Yates ran it through Octave No Rights Reserved CriticalFrequencyAliasing svg Line charts Nyquist plots
