Download:
| Tiny | 157x128 | View | Download |
| Original svg | 283x230 | View | Download |
| Original as jpg | 283x230 | View | Download |
This image was acquired from
wikimedia. It was marked as Public Domain or CC0 and is free to use. To verify, go to the source and check the information there.
Looking for more info about this image?
Try a Google Reverse Image Search for it.
Try a Google Reverse Image Search for it.
Keywords from Image Description:
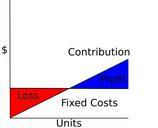
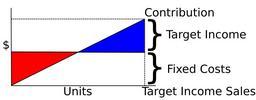
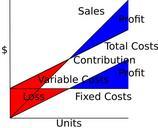
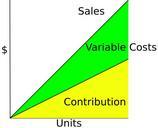
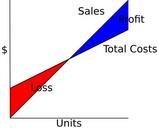
CVPFCContribPLBEP.svg CostVolumeProfit diagram showing BreakEven Point as point where Contribution equals Fixed Costs Selfmade in Inkscape Created with Inkscape Nils Barth Translation possible Cost and revenue curves Breakeven charts

