Related Images


Download:
| Tiny | 165x128 | View | Download |
| Small | 331x256 | View | Download |
| Medium | 662x512 | View | Download |
| Original svg | 797x616 | View | Download |
| Original as jpg | 797x616 | View | Download |
This image was acquired from
wikimedia. It was marked as Public Domain or CC0 and is free to use. To verify, go to the source and check the information there.
Looking for more info about this image?
Try a Google Reverse Image Search for it.
Try a Google Reverse Image Search for it.
Keywords from Image Description:
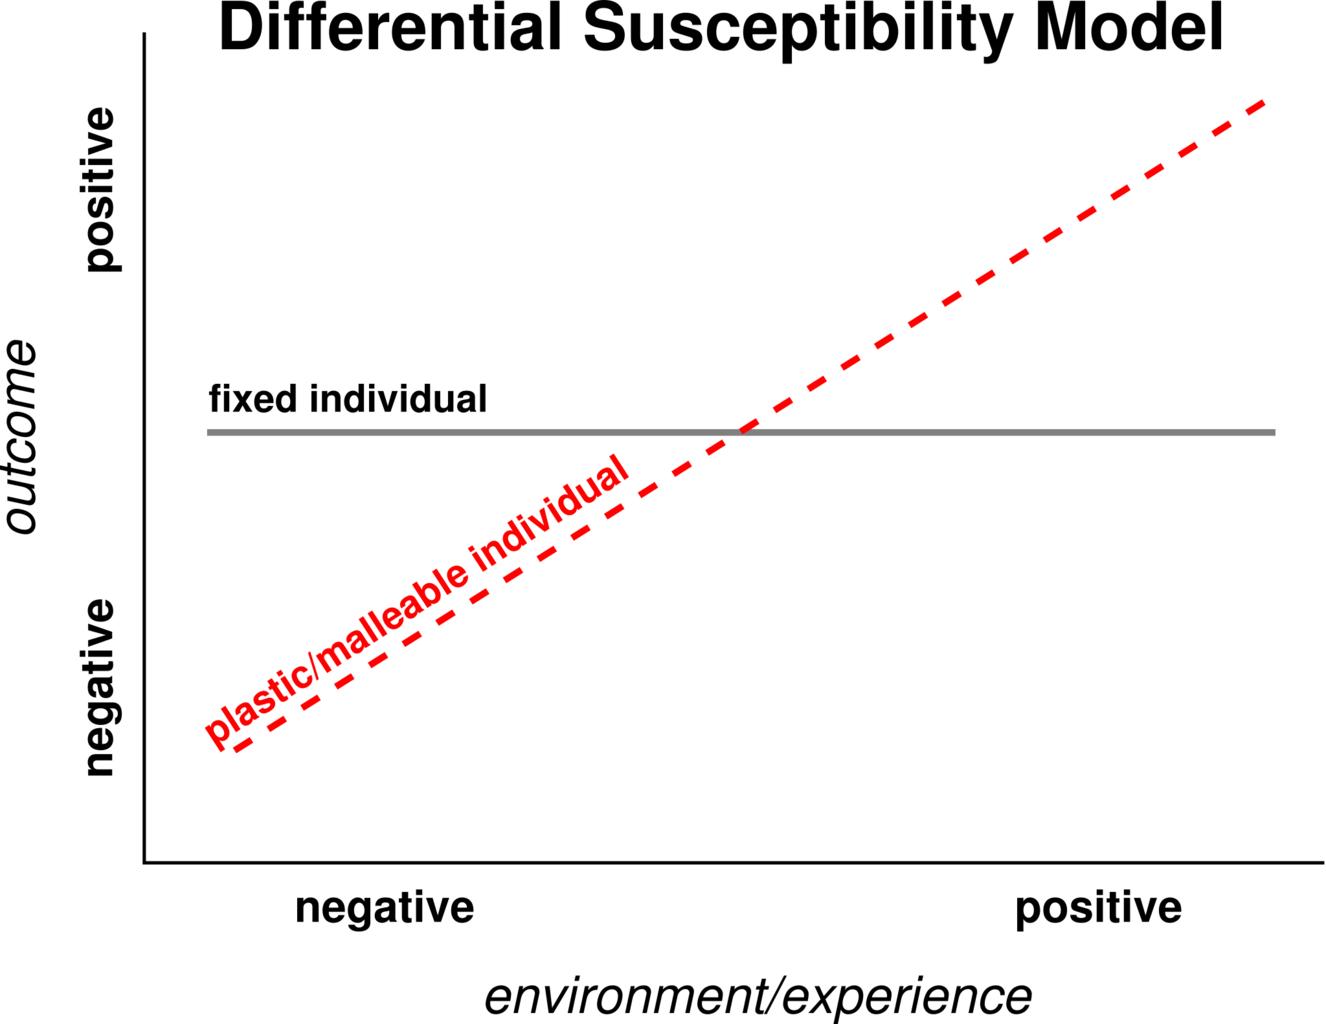
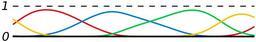
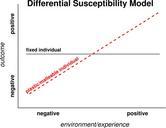
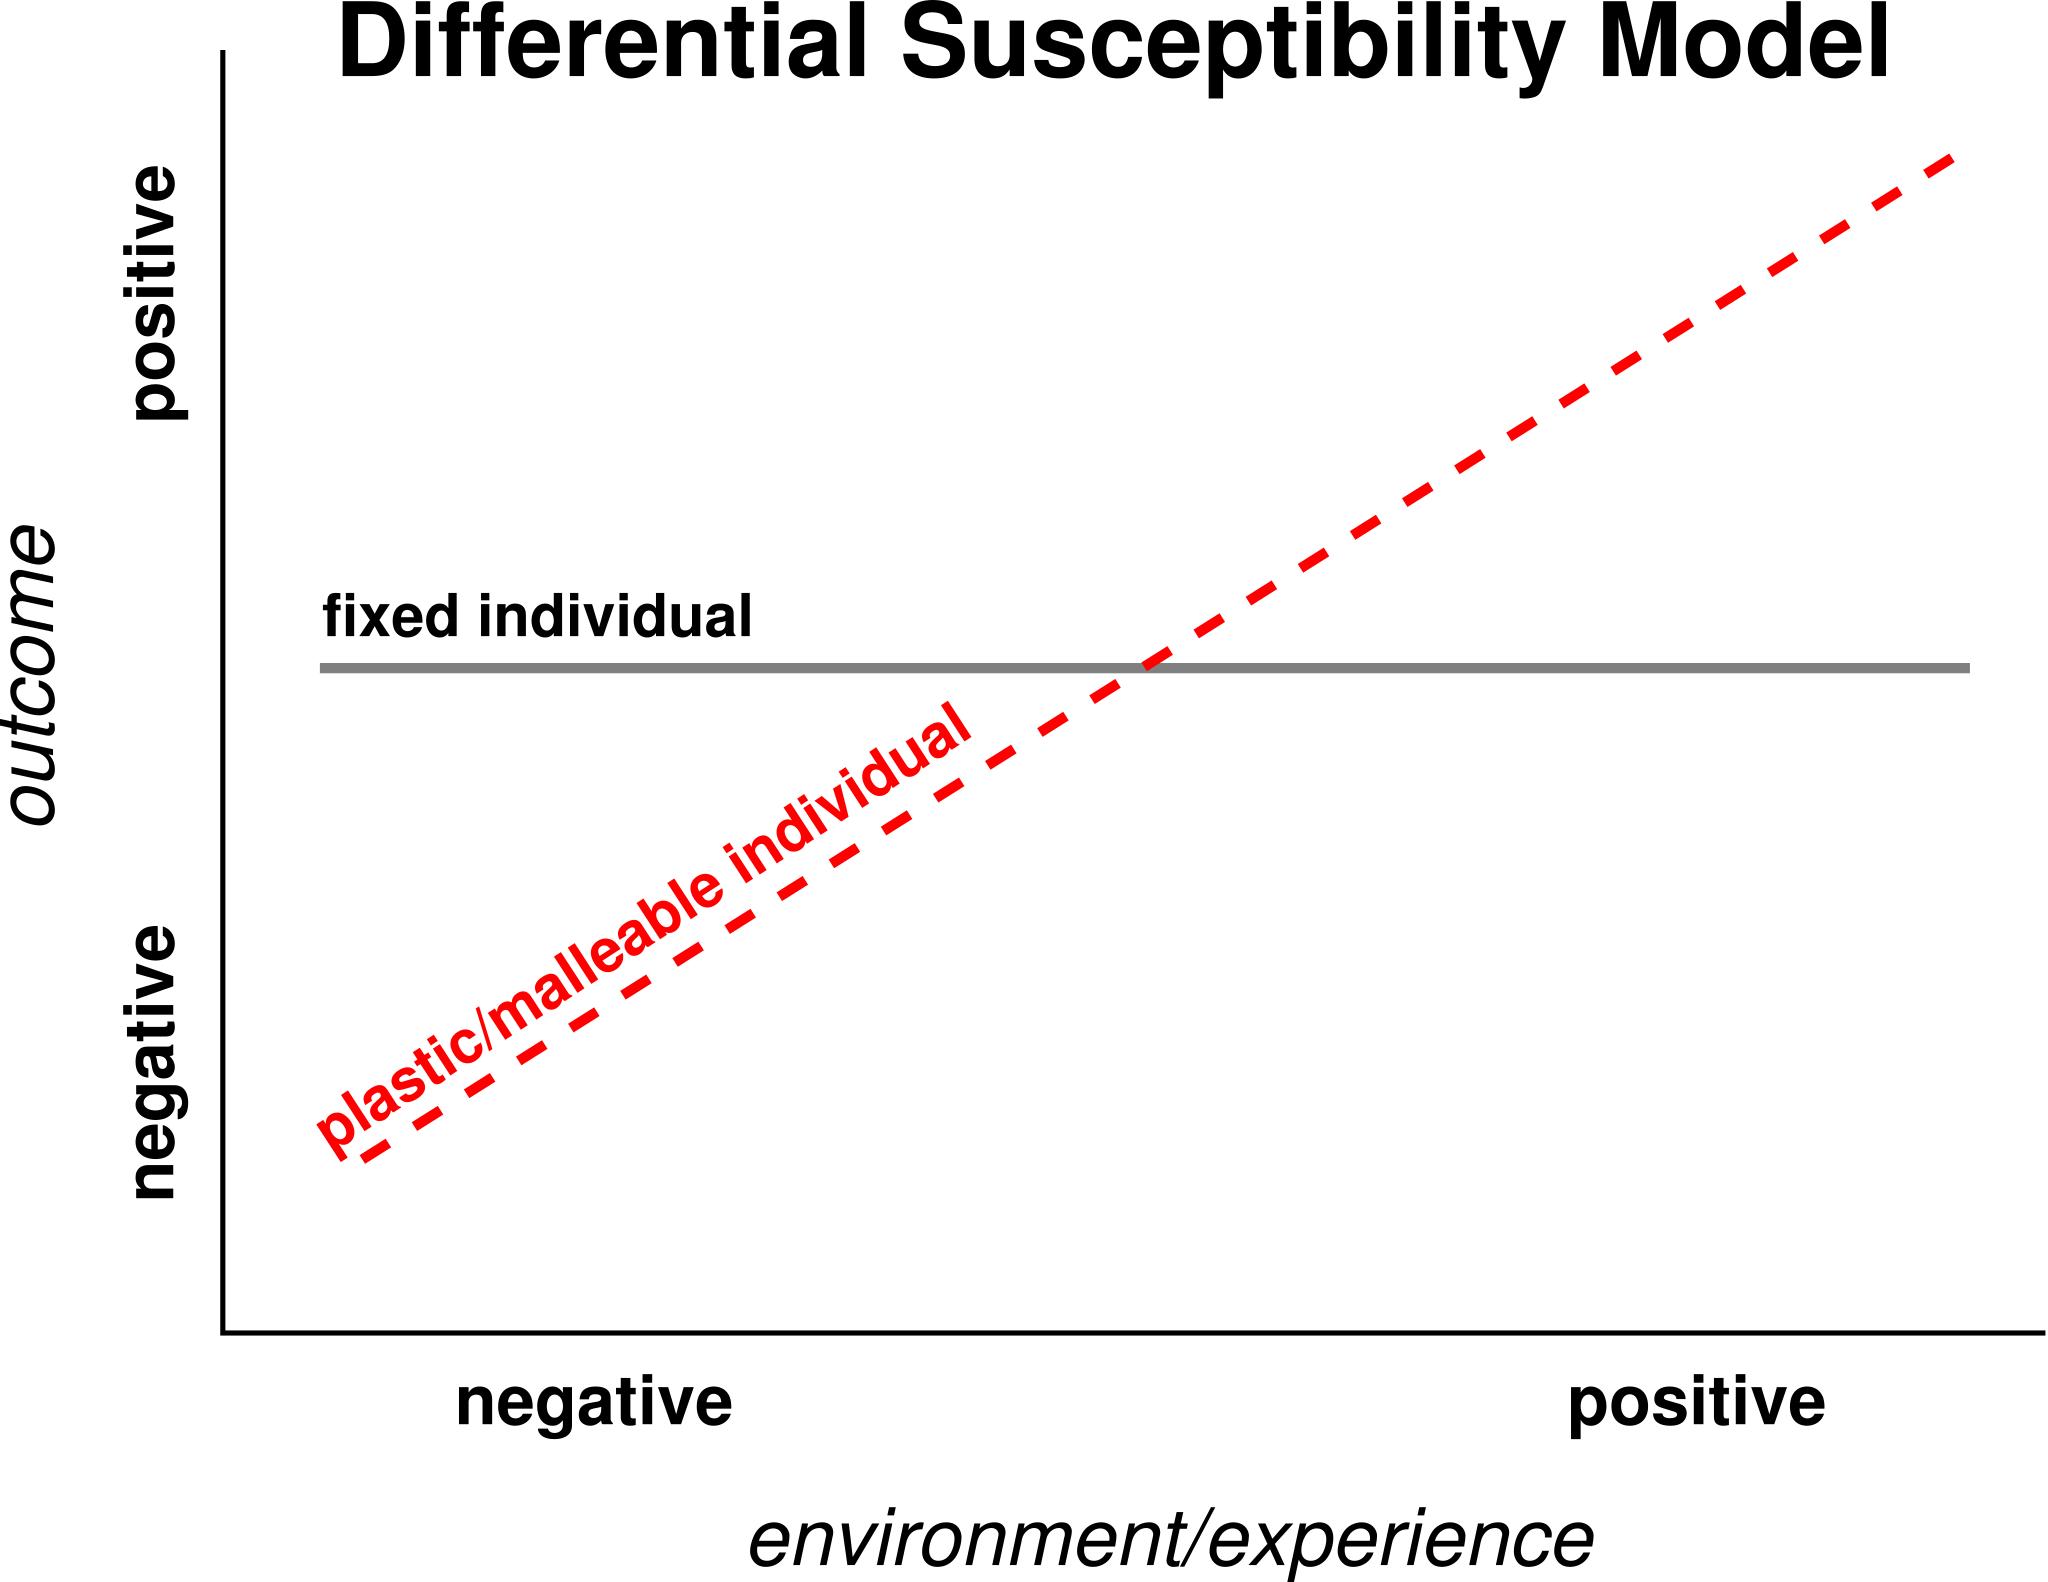
Differentialsusceptibilitymodel.svg en Figure Graphical display of the differential susceptibility model The Xaxis indicates quality of the environment from negative to positive The Yaxis indicates the developmental outcome from negative to positive The lines depict two categorical groups that differ in their responsiveness to the