Related Images

Download:
| Tiny | 184x128 | View | Download |
| Small | 368x256 | View | Download |
| Original svg | 525x365 | View | Download |
| Original as jpg | 525x365 | View | Download |
This image was acquired from
wikimedia. It was marked as Public Domain or CC0 and is free to use. To verify, go to the source and check the information there.
Looking for more info about this image?
Try a Google Reverse Image Search for it.
Try a Google Reverse Image Search for it.
Keywords from Image Description:
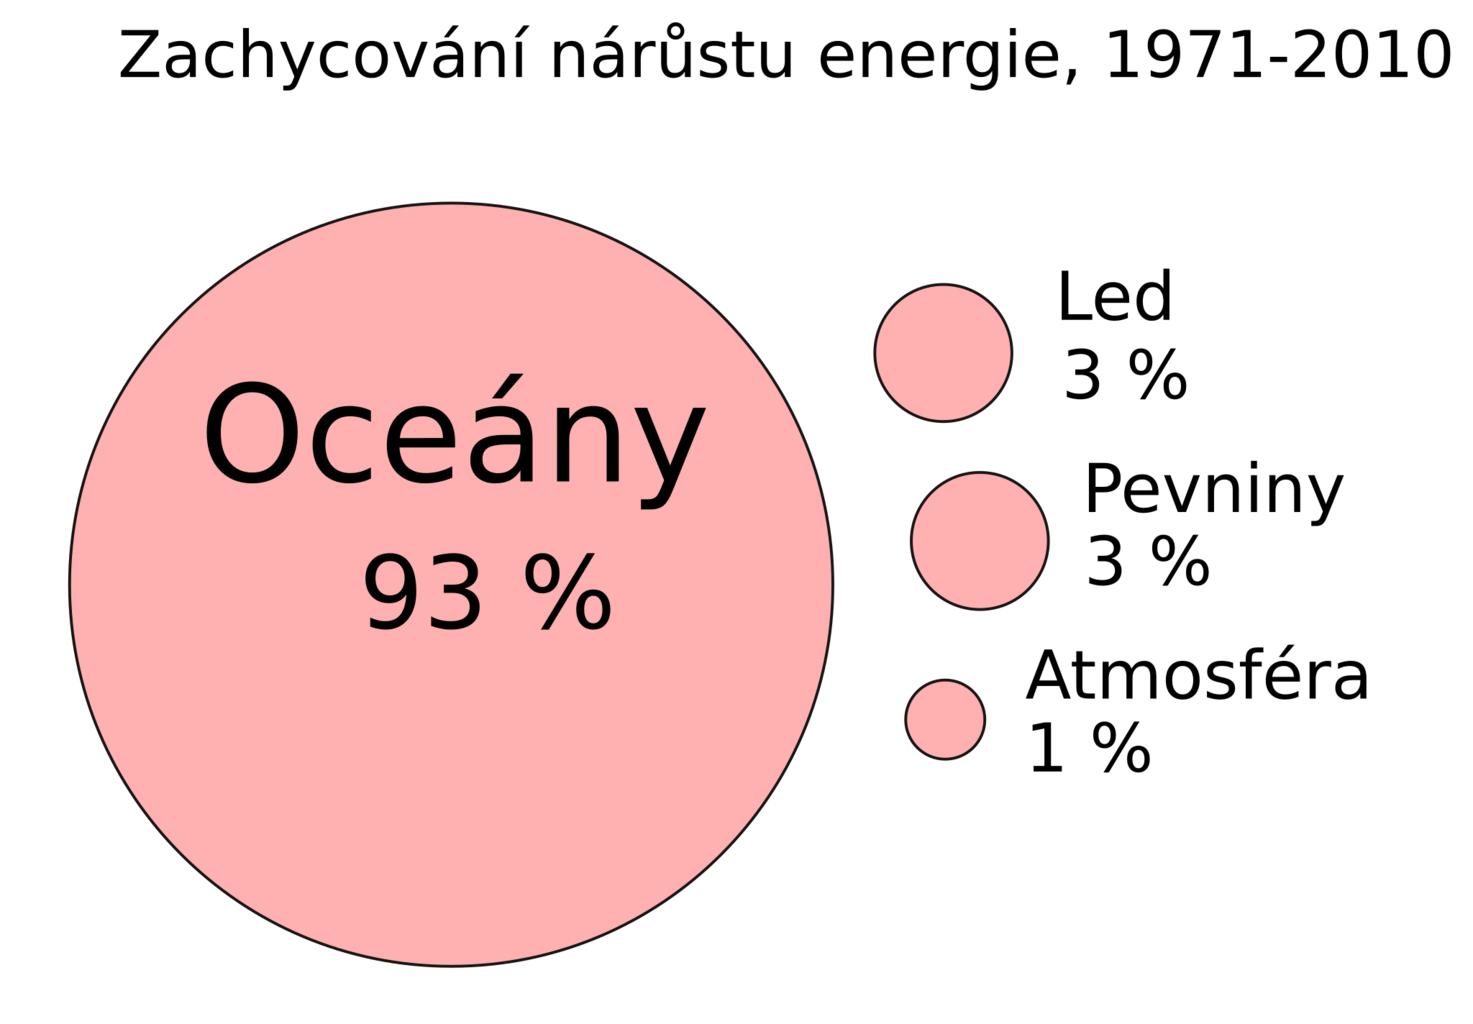
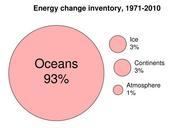
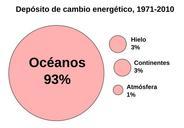
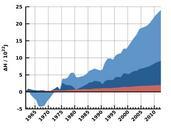
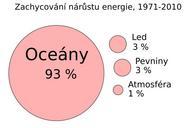
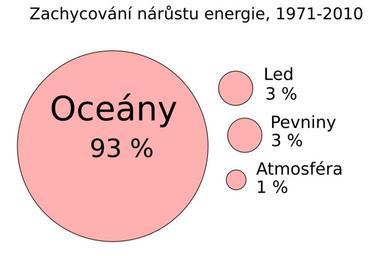
Energy change inventory cs.svg en English This bubble graph shows how the extra energy trapped by anthropogenic human greenhouse gases has been distributed on the Earth This is referred to as radiative imbalance where less energy leaves Earth's atmosphere than enters it Earth has been in radiative imbalance since at least the Most