
Related Images


Download:
| Tiny | 385x128 | View | Download |
| Original gif | 401x133 | View | Download |
| Original as jpg | 401x133 | View | Download |
This image was acquired from
wikimedia. It was marked as Public Domain or CC0 and is free to use. To verify, go to the source and check the information there.
Looking for more info about this image?
Try a Google Reverse Image Search for it.
Try a Google Reverse Image Search for it.
Keywords from Image Description:
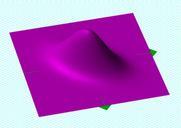
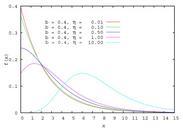
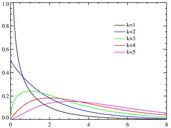
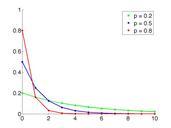
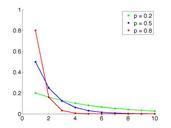
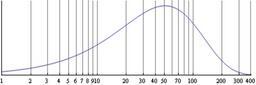
ExpDecayLogPlot. en The logarithmicscale probability density function for an exponentialdecay process The area under the curve between two points is proportional to the probability that the function has value between those two points Note that since the xaxis is distorted by the logarithmic scaling the height is also distorted compared