Related Images

Download:
| Tiny | 168x128 | View | Download |
| Small | 336x256 | View | Download |
| Medium | 672x512 | View | Download |
| Original png | 804x612 | View | Download |
| Original as jpg | 804x612 | View | Download |
This image was acquired from
wikimedia. It was marked as Public Domain or CC0 and is free to use. To verify, go to the source and check the information there.
Looking for more info about this image?
Try a Google Reverse Image Search for it.
Try a Google Reverse Image Search for it.
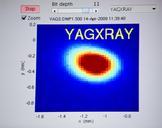
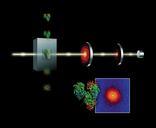
Keywords from Image Description:
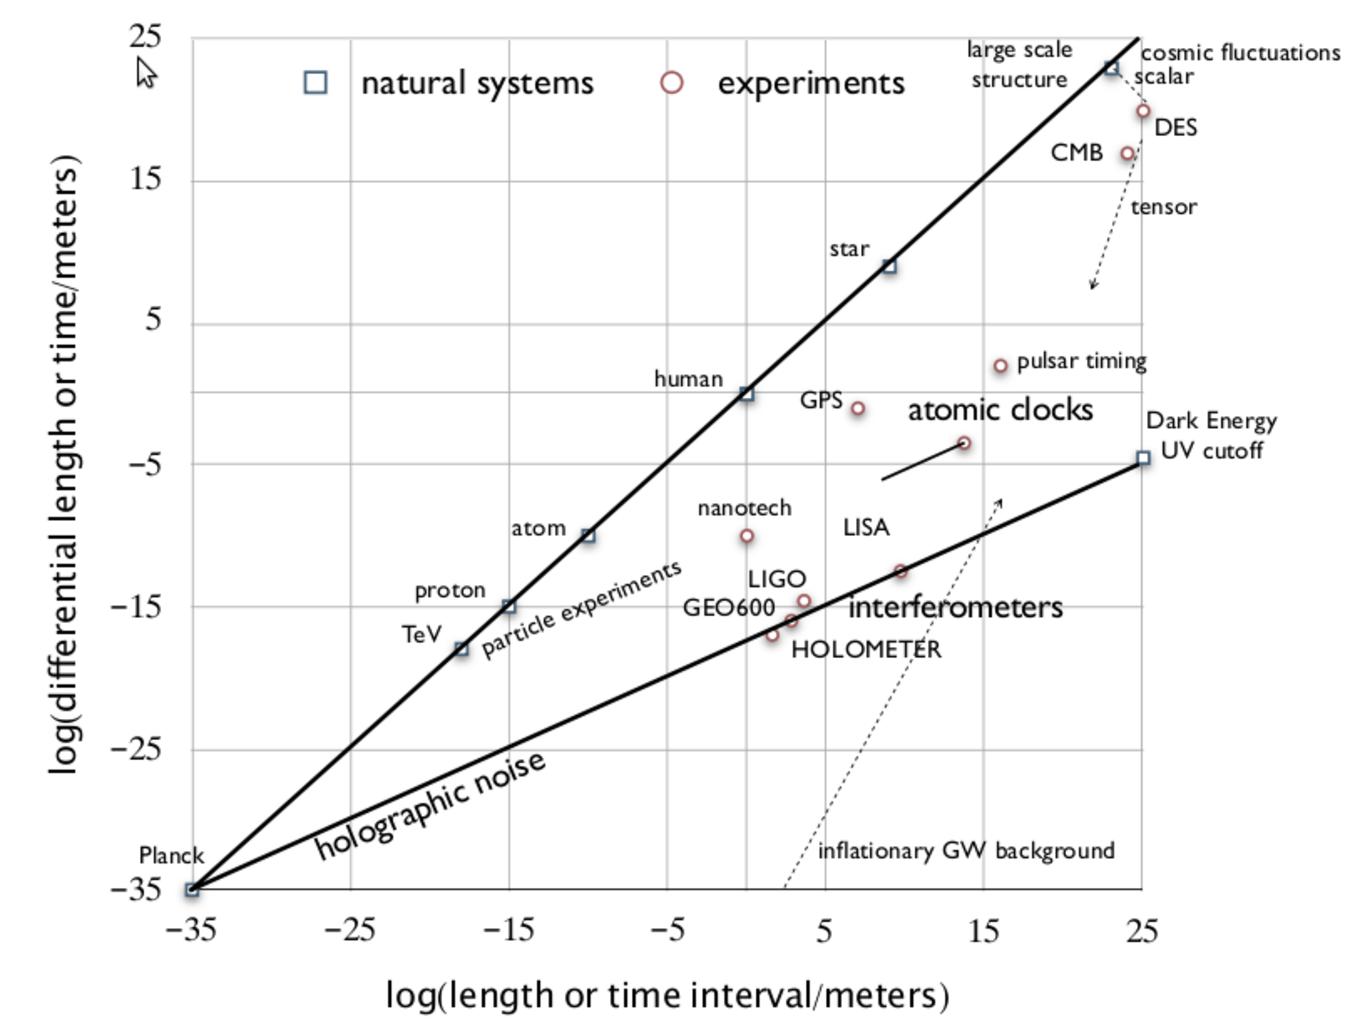
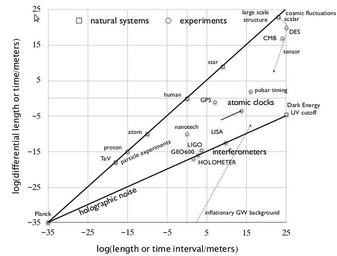
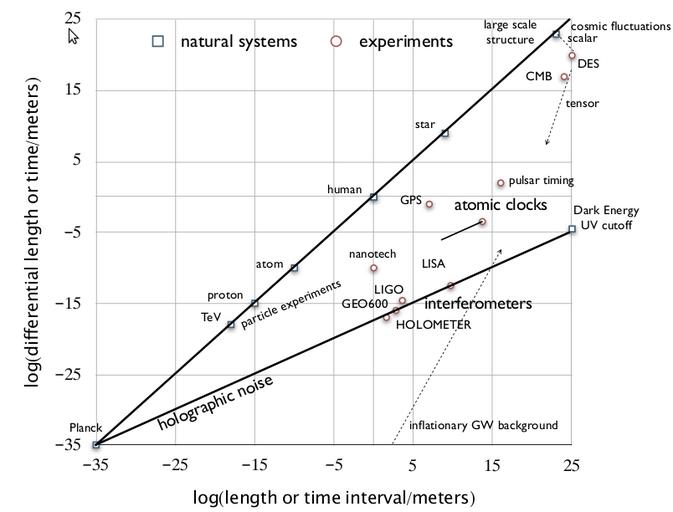
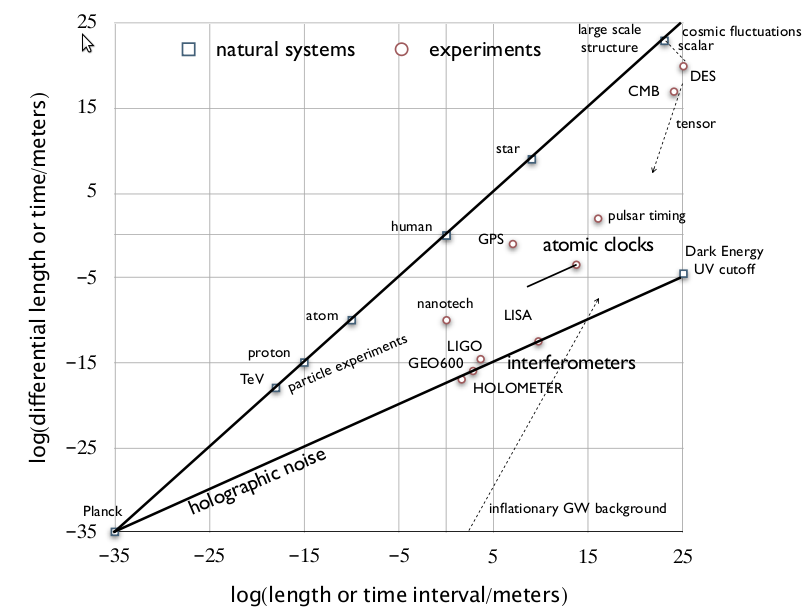
Fermi National Accelerator Laboratory Holographic Noise Chart. graph en This plot shows the sensitivity of various experiments to fluctuations in space and time Horizontal axis is the log of apparatus size or duration time the speed of light in meters vertical axis is the log of the rms fluctuation amplitude in the same units The