
Related Images


Download:
| Tiny | 192x128 | View | Download |
| Small | 384x256 | View | Download |
| Medium | 769x512 | View | Download |
| Original svg | 896x596 | View | Download |
| Original as jpg | 896x596 | View | Download |
This image was acquired from
wikimedia. It was marked as Public Domain or CC0 and is free to use. To verify, go to the source and check the information there.
Looking for more info about this image?
Try a Google Reverse Image Search for it.
Try a Google Reverse Image Search for it.
Keywords from Image Description:
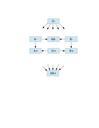
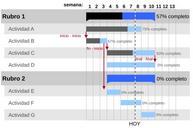
GanttChartAnatomyES.svg en Gantt chart showing three kinds of schedule dependencies in red percent complete indications and activity groups es Diagrama de Gantt mostrando tres tipos de precedencias en rojo porcentajes de avance agrupacin de actividades en rubros traduccin del archivo original en ingls en commons org GanttChartAnatomy