
Related Images


Download:
| Tiny | 159x128 | View | Download |
| Small | 318x256 | View | Download |
| Medium | 637x512 | View | Download |
| Large | 1274x1024 | View | Download |
| Original | 1413x1135 | View | Download |
This image was acquired from
wikimedia. It was marked as Public Domain or CC0 and is free to use. To verify, go to the source and check the information there.
Looking for more info about this image?
Try a Google Reverse Image Search for it.
Try a Google Reverse Image Search for it.
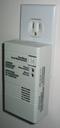
Keywords from Image Description:
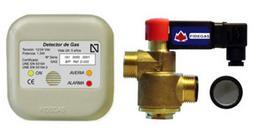
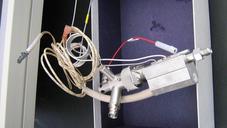
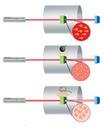
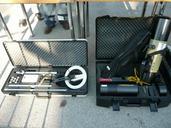
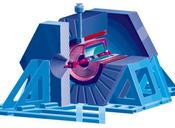
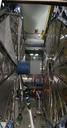
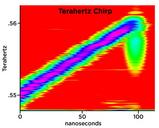
Gas Detector . Graph shows the NIST detectors linear increase in frequency as function of time sweeping from Gigahertz in frequency over nanoseconds Click on the image to see an animation of the process slowed to seconds and using an audio chirp as an analogy to the terahertz chirp Credit Plusquellic NIST See also nist gov cfm