Related Images
Download:
| Tiny | 170x128 | View | Download |
| Small | 341x256 | View | Download |
| Medium | 682x512 | View | Download |
| Original svg | 1024x768 | View | Download |
| Original as jpg | 1024x768 | View | Download |
This image was acquired from
wikimedia. It was marked as Public Domain or CC0 and is free to use. To verify, go to the source and check the information there.
Looking for more info about this image?
Try a Google Reverse Image Search for it.
Try a Google Reverse Image Search for it.
Keywords from Image Description:
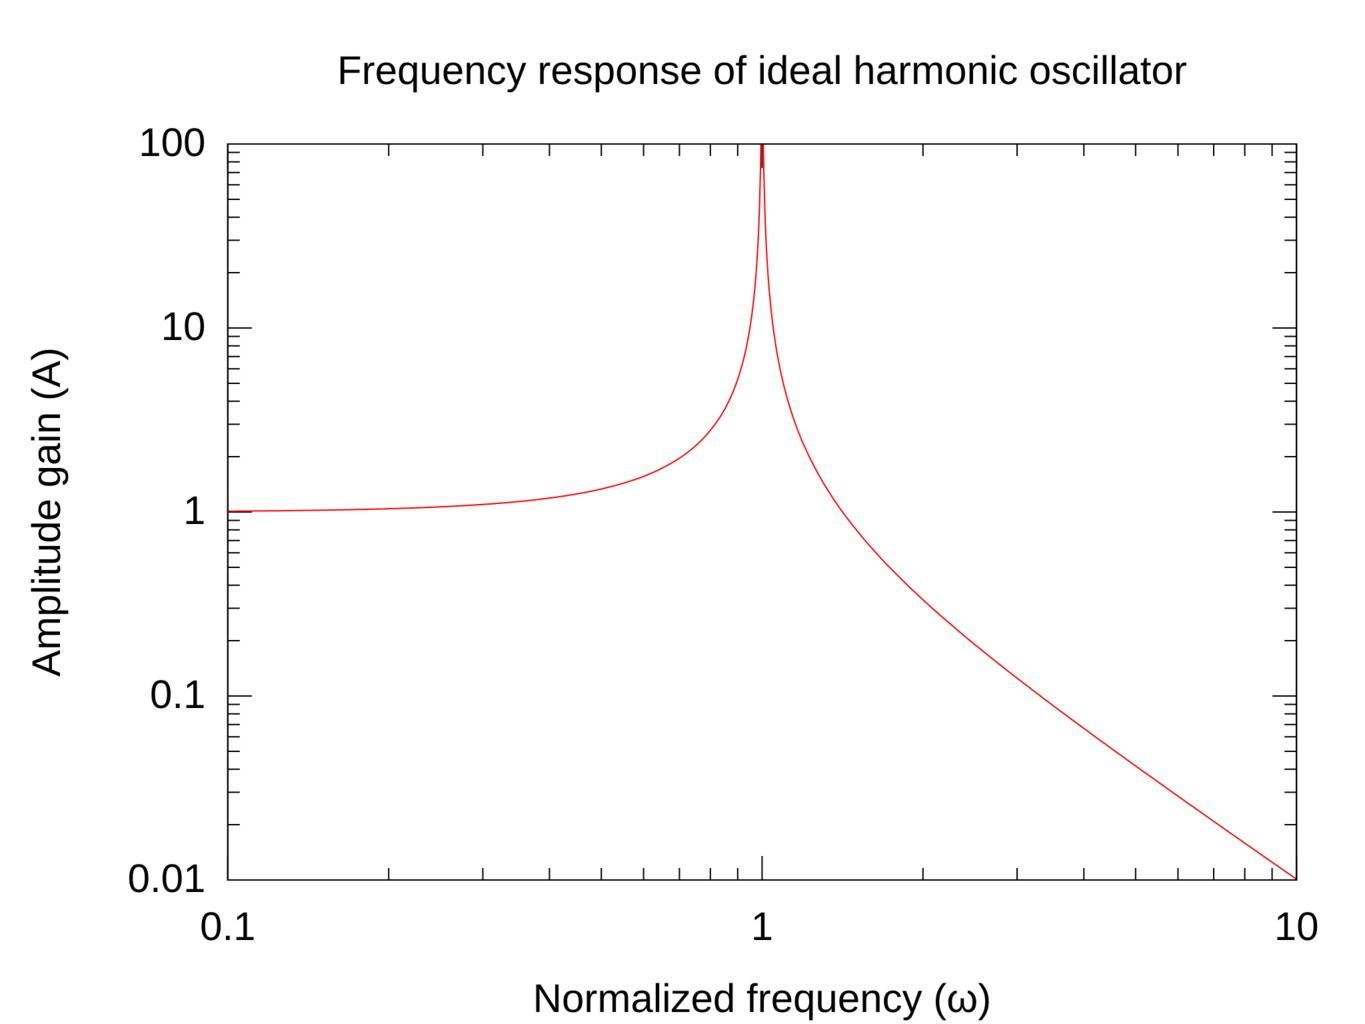
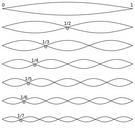
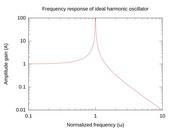
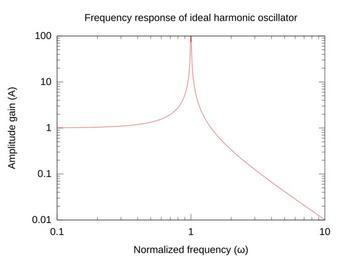
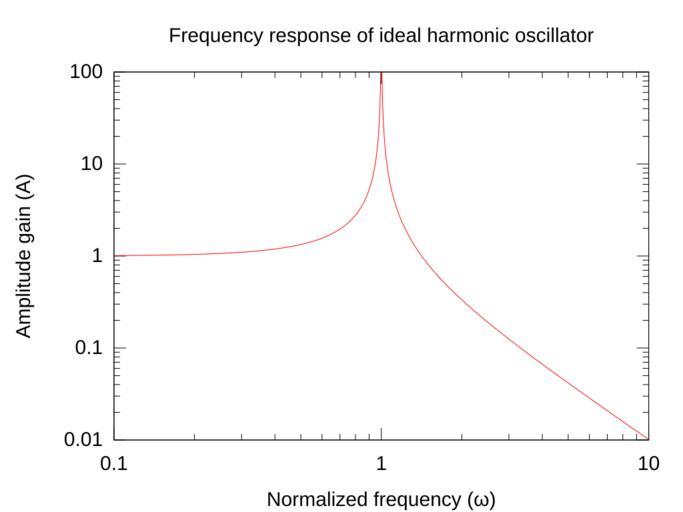
Harmonic oscillator gain.svg Loglog plot of the frequency response of an ideal harmonic oscillator made with Gnuplot The three sections of the graph can be understood as follows Below resonance the gain is approximately one because the oscillator simply follows the driving force neither amplifying nor attenuating it Near resonance