
Related Images
Download:
| Tiny | 120x128 | View | Download |
| Small | 240x256 | View | Download |
| Original svg | 350x373 | View | Download |
| Original as jpg | 350x373 | View | Download |
This image was acquired from
wikimedia. It was marked as Public Domain or CC0 and is free to use. To verify, go to the source and check the information there.
Looking for more info about this image?
Try a Google Reverse Image Search for it.
Try a Google Reverse Image Search for it.
Keywords from Image Description:
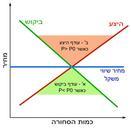
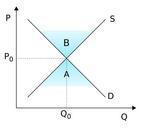
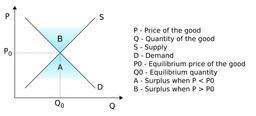
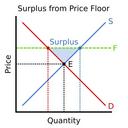
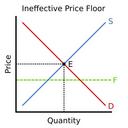
Ineffective Price Floor.svg An illustrative supply graph showing an ineffective price floor below equilibrium price Line red represents the demand price vs quantity demanded line blue represents the supply price vs quantity supplied point black is the equilibrium point and line green dashed represents the price floor Own work based