Related Images


Download:
| Tiny | 110x128 | View | Download |
| Small | 221x256 | View | Download |
| Original png | 257x297 | View | Download |
| Original as jpg | 257x297 | View | Download |
This image was acquired from
wikimedia. It was marked as Public Domain or CC0 and is free to use. To verify, go to the source and check the information there.
Looking for more info about this image?
Try a Google Reverse Image Search for it.
Try a Google Reverse Image Search for it.
Keywords from Image Description:
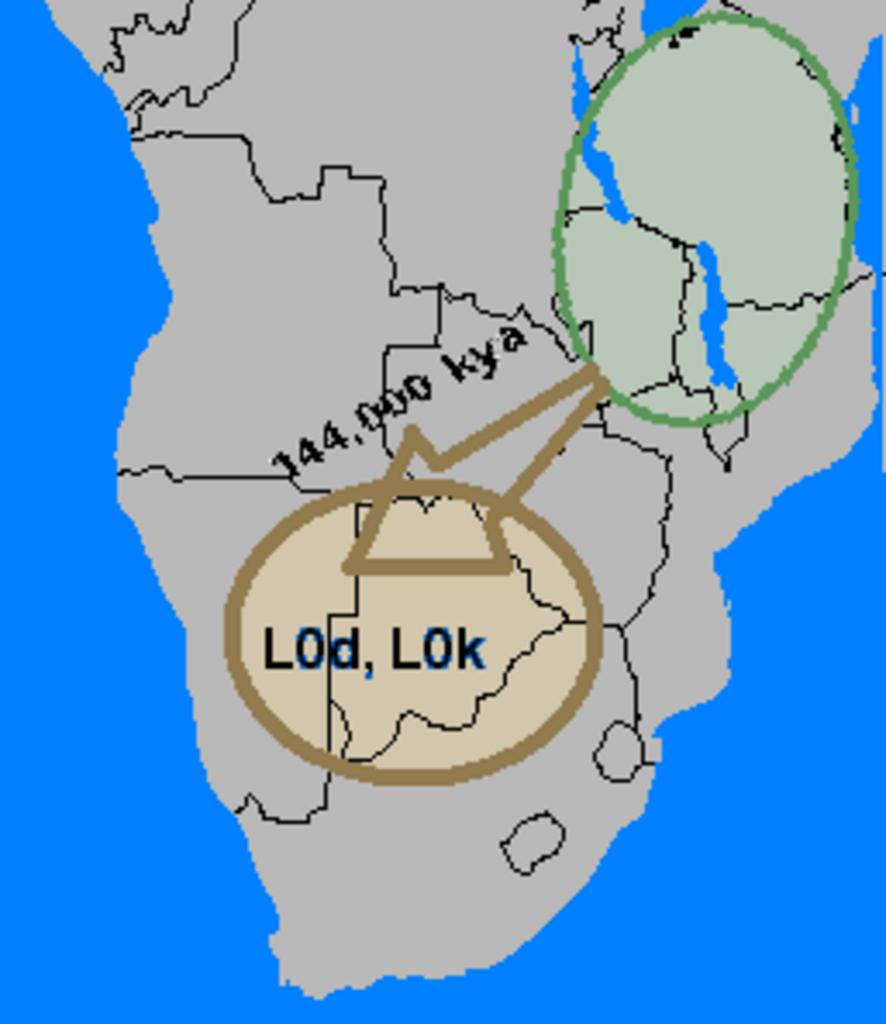
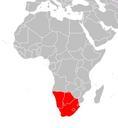
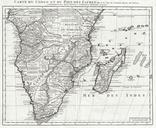
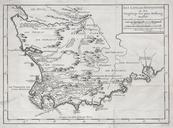
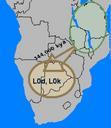
InitialExpansionMitogenome. Map was cropped to show Southern Africa The regions of Africa with the deepest mitochondrial DNA diversity are shown in Green while those enriched in Ld and Lk are shown in light brown The approximation of the boundaries of the green areas come from Gonder et al Whole mtDAN genome sequences analysis of