Related Images


Download:
| Tiny | 110x128 | View | Download |
| Small | 221x256 | View | Download |
| Medium | 442x512 | View | Download |
| Original png | 640x740 | View | Download |
| Original as jpg | 640x740 | View | Download |
This image was acquired from
wikimedia. It was marked as Public Domain or CC0 and is free to use. To verify, go to the source and check the information there.
Looking for more info about this image?
Try a Google Reverse Image Search for it.
Try a Google Reverse Image Search for it.
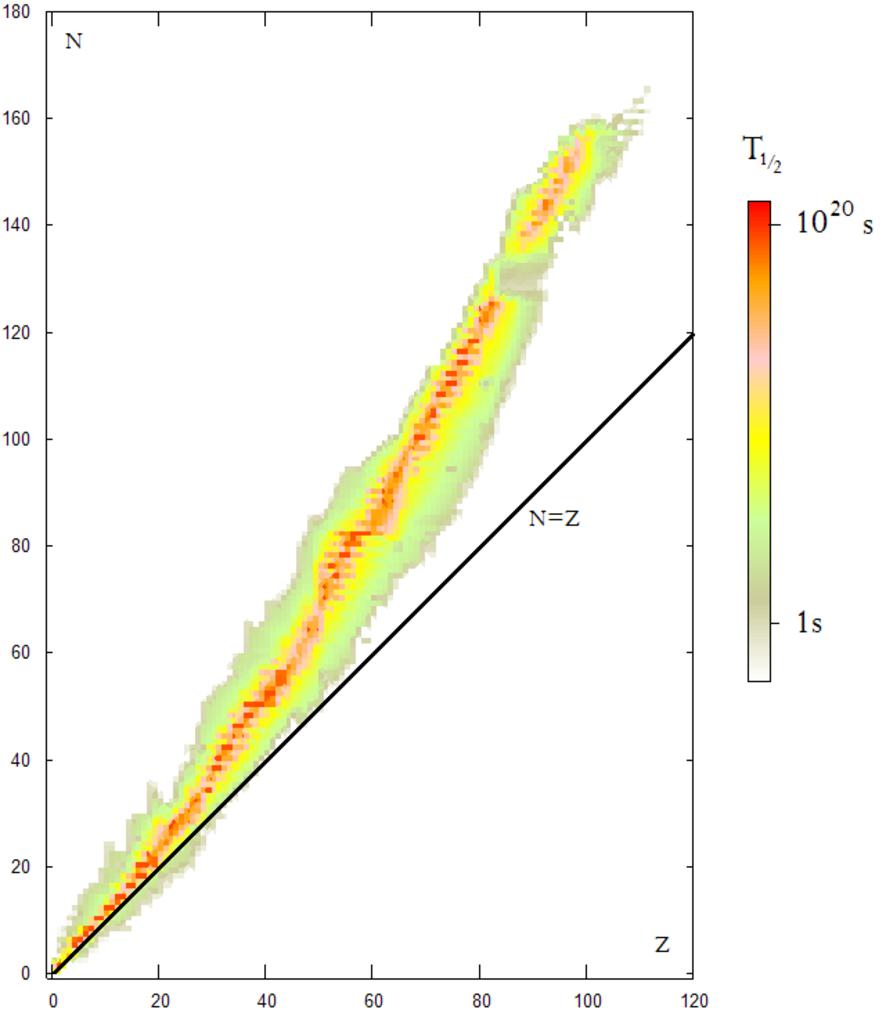
Keywords from Image Description:
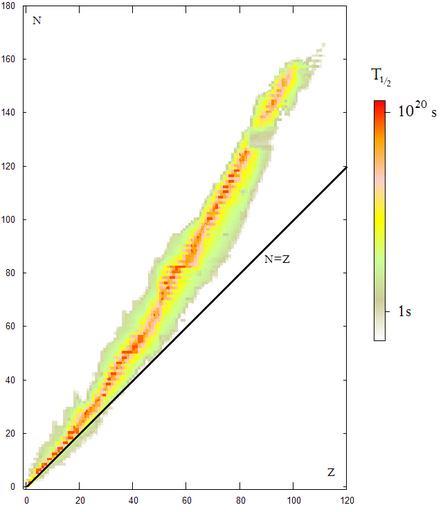
Isotopes and halflife. The Nuclear Chart which represent every known nucleus stable and unstable Plotted as number of protons versus number of neutrons The color corresponds to the value of the halflife seconds Made by fffred with gnuplot graph Isotopes Nuclear physics