Related Images


Download:
| Tiny | 201x128 | View | Download |
| Small | 402x256 | View | Download |
| Medium | 804x512 | View | Download |
| Original | 910x579 | View | Download |
This image was acquired from
wikimedia. It was marked as Public Domain or CC0 and is free to use. To verify, go to the source and check the information there.
Looking for more info about this image?
Try a Google Reverse Image Search for it.
Try a Google Reverse Image Search for it.
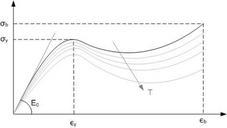
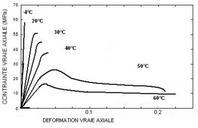
Keywords from Image Description:
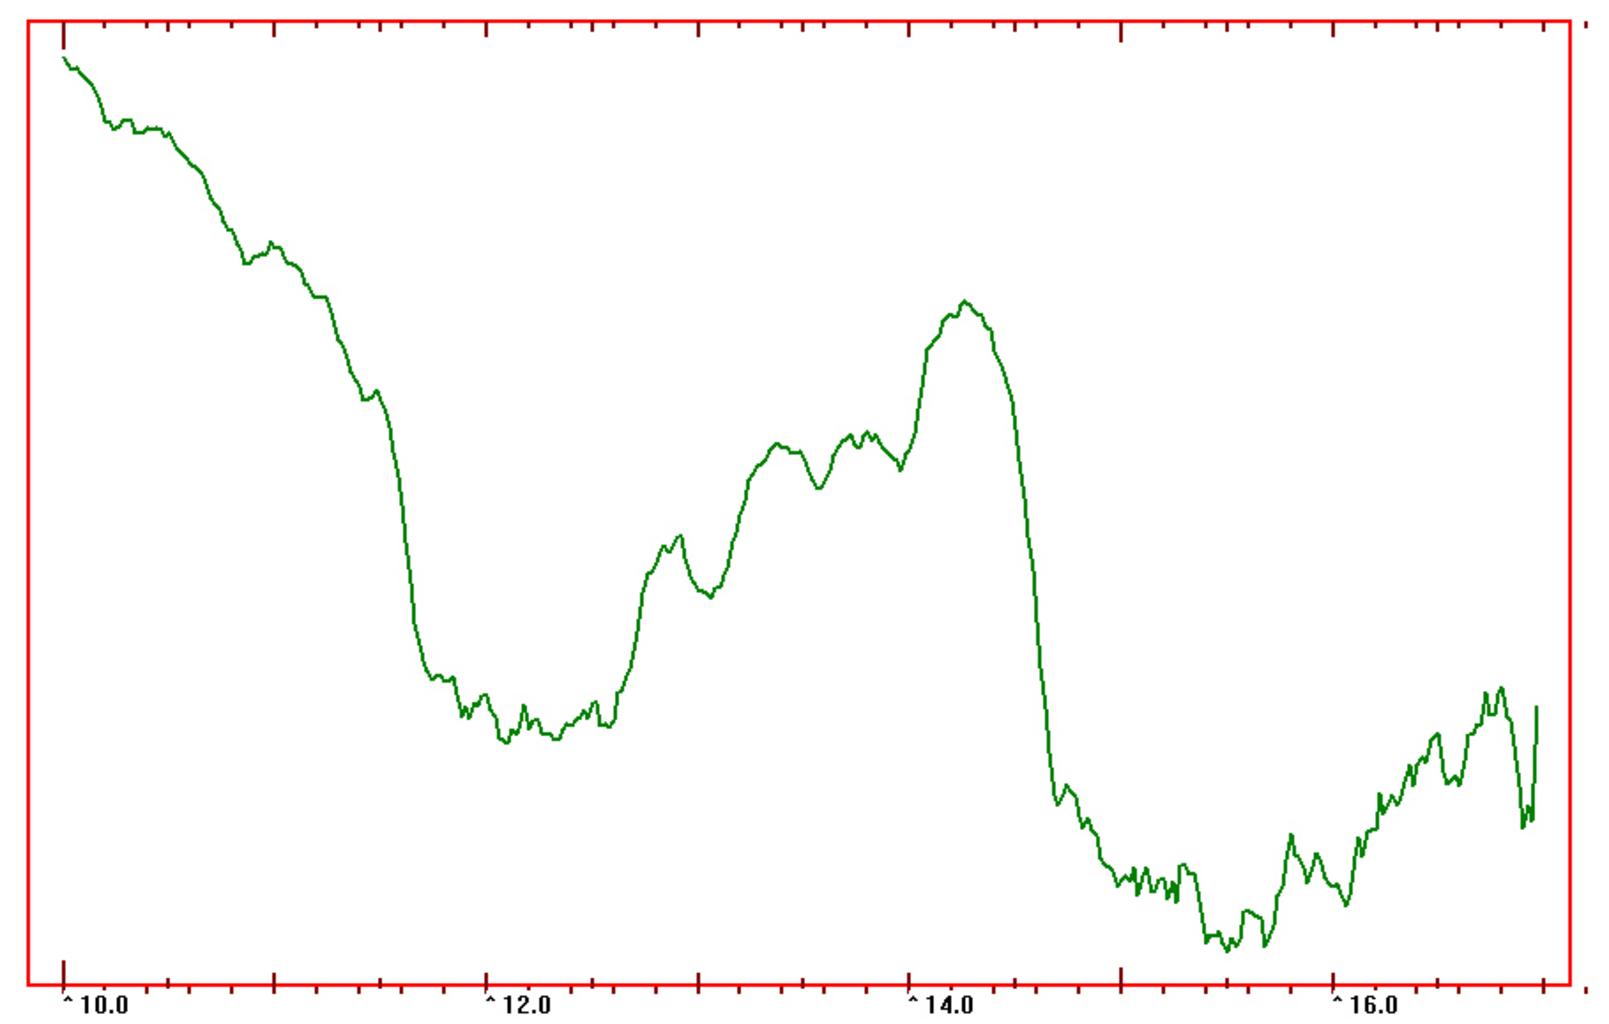
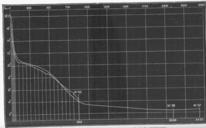
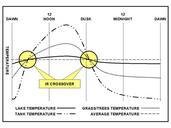
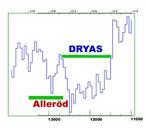
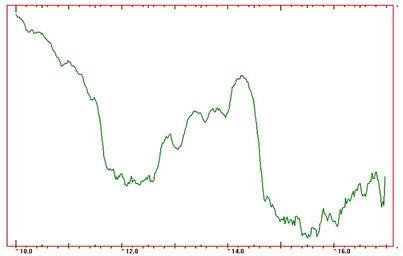
Late glacial temperature curve. Temperature curve of late glacial period from NGRIP greenland ice core oxygen isotope ratio Numbers thousands of years ago time goes from right to left up is warmer down is colder The periot spans from Lascaux interstadial to Heinrich event and to Meiendorf warm stage and Allegd warm stage to Younger