
Related Images


Download:
| Tiny | 170x128 | View | Download |
| Small | 341x256 | View | Download |
| Medium | 682x512 | View | Download |
| Original | 720x540 | View | Download |
This image was acquired from
wikimedia. It was marked as Public Domain or CC0 and is free to use. To verify, go to the source and check the information there.
Looking for more info about this image?
Try a Google Reverse Image Search for it.
Try a Google Reverse Image Search for it.
Keywords from Image Description:
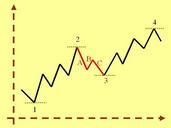
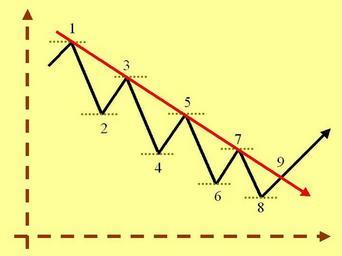
Lineas de tendencia baja. es Grfica de powerpoint de lnea de tendencia bajista con rompimiento en Resistance line as used in the technical analysis of stocks If the stock is trading at or slightly below the line this is sell signal however if it breaks through the line and rises higher this is buy signal Own LCB Technical analysis