Related Images


Download:
| Tiny | 170x128 | View | Download |
| Small | 341x256 | View | Download |
| Medium | 682x512 | View | Download |
| Large | 1365x1024 | View | Download |
| Original png | 1400x1050 | View | Download |
| Original as jpg | 1400x1050 | View | Download |
This image was acquired from
wikimedia. It was marked as Public Domain or CC0 and is free to use. To verify, go to the source and check the information there.
Looking for more info about this image?
Try a Google Reverse Image Search for it.
Try a Google Reverse Image Search for it.
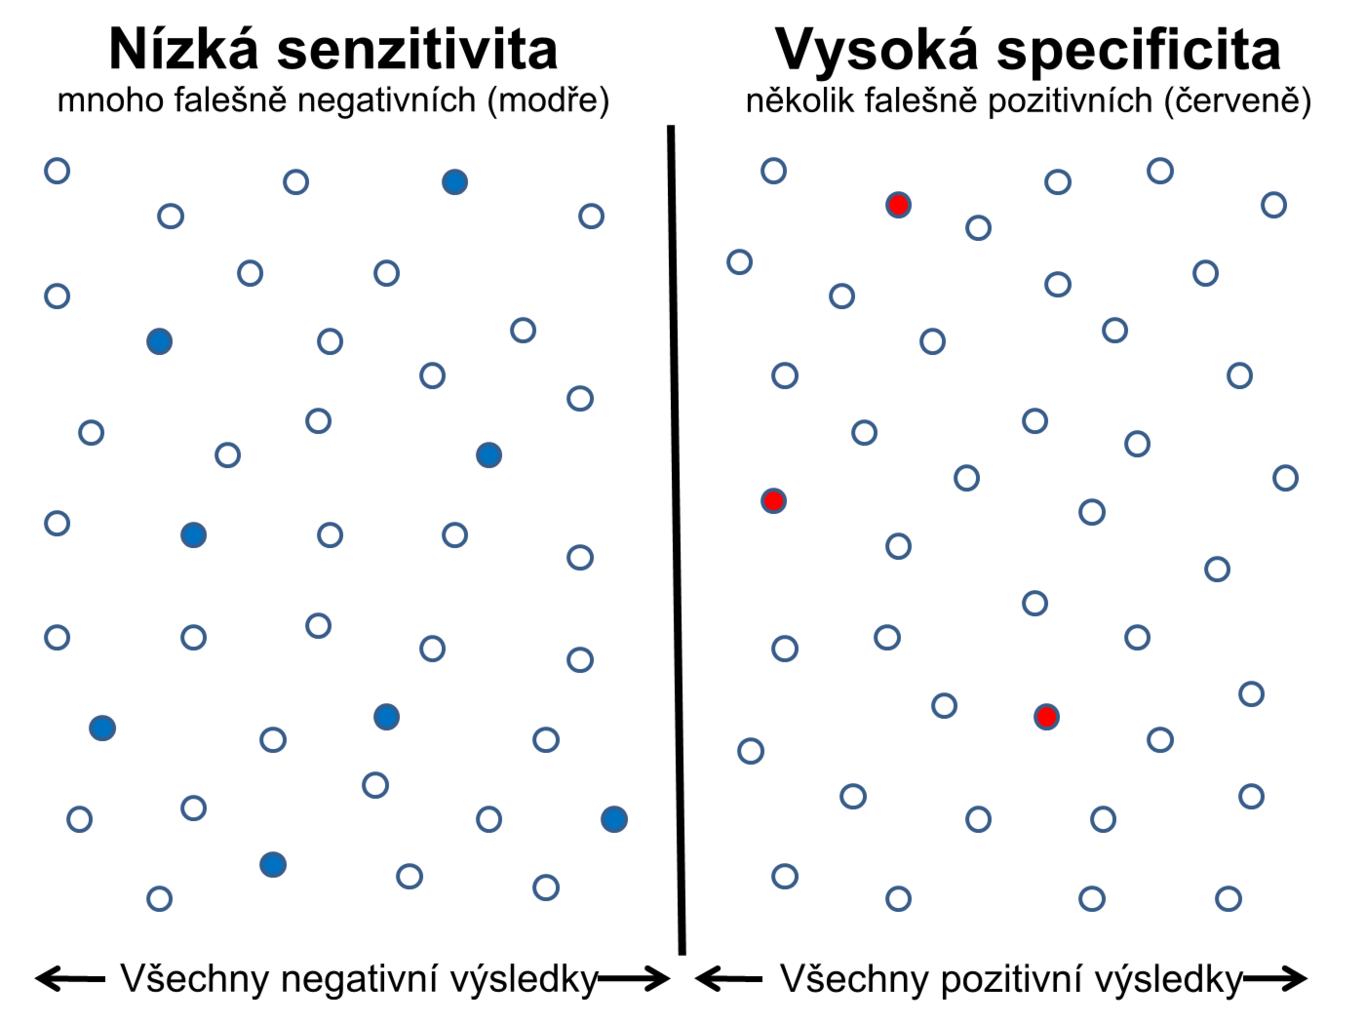
Keywords from Image Description:
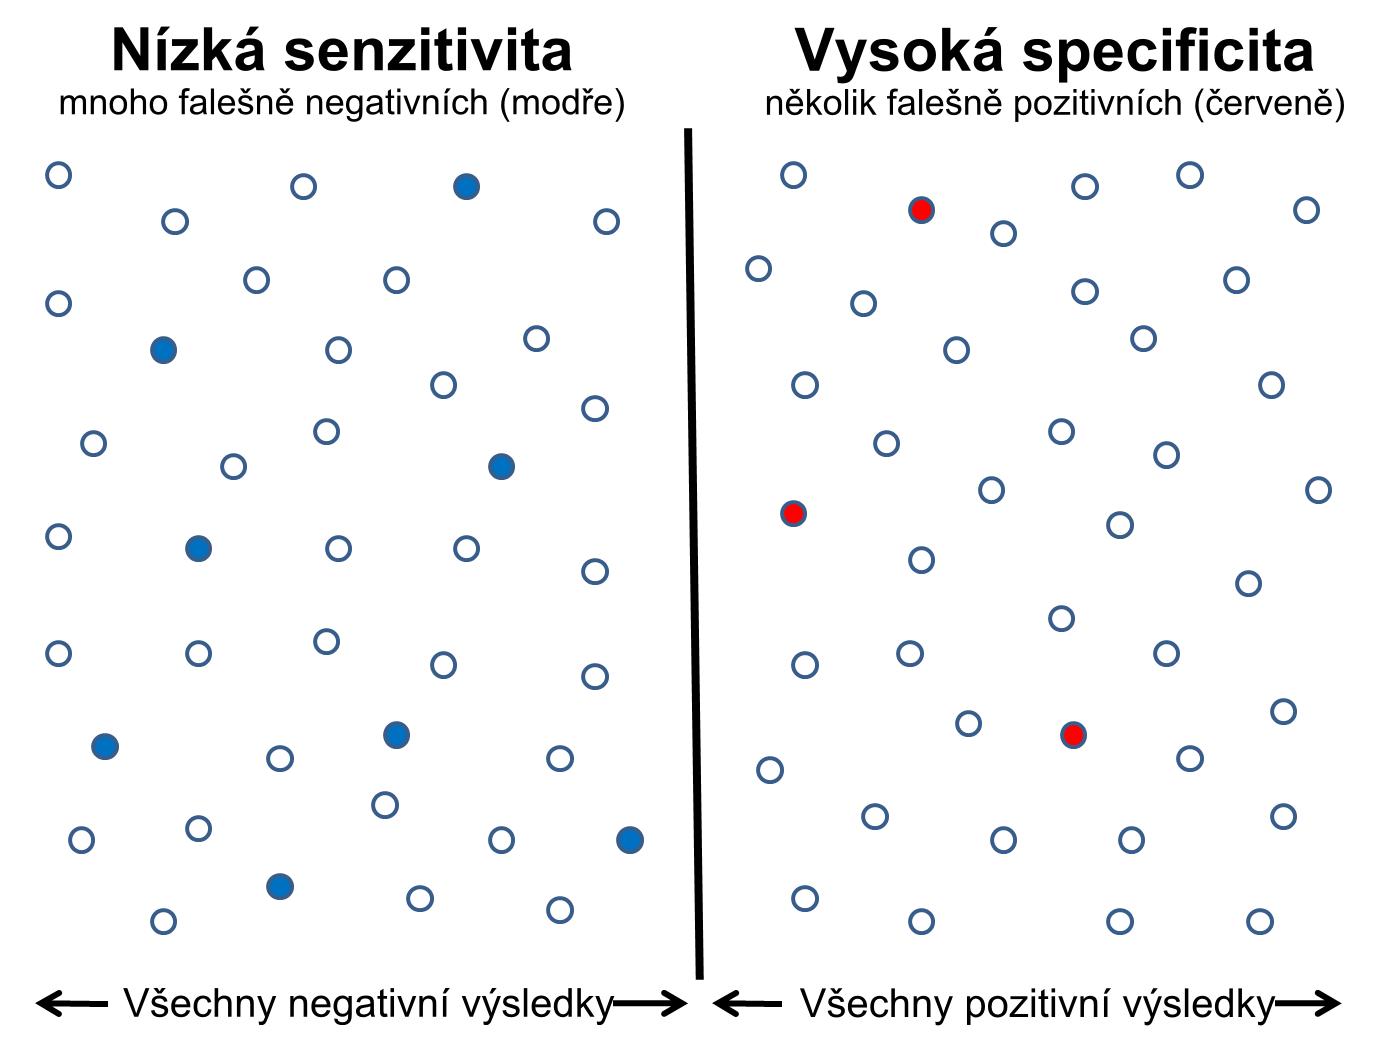
LowSensitivity HighSpecificity cs. en Graphical illustration of low sensitivity and high specificity Each data point is represented by circle Data which failed the test are drawn on the left side of the vertical bar and data which passed the test are drawn on the right side of the vertical bar False negatives are shown as closed