
Related Images


Download:
| Tiny | 208x128 | View | Download |
| Small | 416x256 | View | Download |
| Medium | 833x512 | View | Download |
| Original png | 977x600 | View | Download |
| Original as jpg | 977x600 | View | Download |
This image was acquired from
wikimedia. It was marked as Public Domain or CC0 and is free to use. To verify, go to the source and check the information there.
Looking for more info about this image?
Try a Google Reverse Image Search for it.
Try a Google Reverse Image Search for it.
Keywords from Image Description:
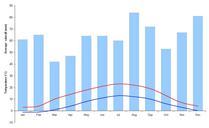
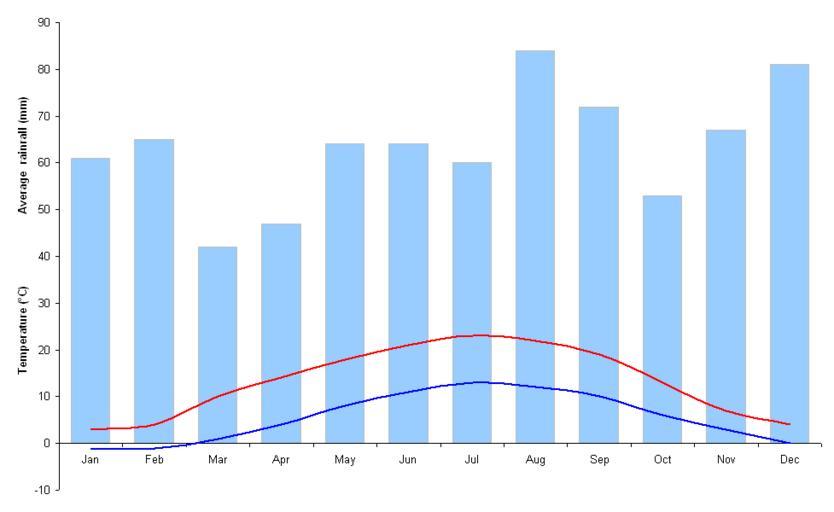
Luxembourg City climate. Graph illustrating Luxembourg City's rainfall and maximum and minimum temperatures over the course of the year Data from bbc co uk shtml tt TT BBC Weather own User Bastin Charts and diagrams of Luxembourg City Climate diagrams of Luxembourg Luxembourg City graph