
Related Images

Download:
| Tiny | 126x128 | View | Download |
| Small | 253x256 | View | Download |
| Original svg | 402x406 | View | Download |
| Original as jpg | 402x406 | View | Download |
This image was acquired from
wikimedia. It was marked as Public Domain or CC0 and is free to use. To verify, go to the source and check the information there.
Looking for more info about this image?
Try a Google Reverse Image Search for it.
Try a Google Reverse Image Search for it.
Keywords from Image Description:
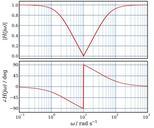
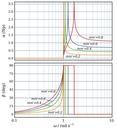
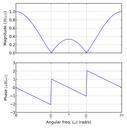
MAAmp C.svg en Frequency response of jomega frac left jomega jomega right The top plot is the magnitude plot and the bottom plot is the phase plot At the two frequencies where the magnitude goes to zero there is sign reversal which causes the phase discontinuities by radians Thus they are true discontinuities not artifacts