Related Images

Download:
| Tiny | 128x128 | View | Download |
| Small | 256x256 | View | Download |
| Medium | 512x512 | View | Download |
| Original svg | 720x720 | View | Download |
| Original as jpg | 720x720 | View | Download |
This image was acquired from
wikimedia. It was marked as Public Domain or CC0 and is free to use. To verify, go to the source and check the information there.
Looking for more info about this image?
Try a Google Reverse Image Search for it.
Try a Google Reverse Image Search for it.
Keywords from Image Description:
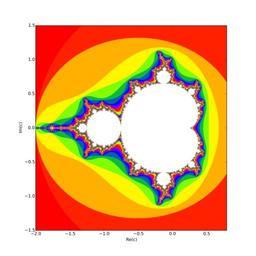
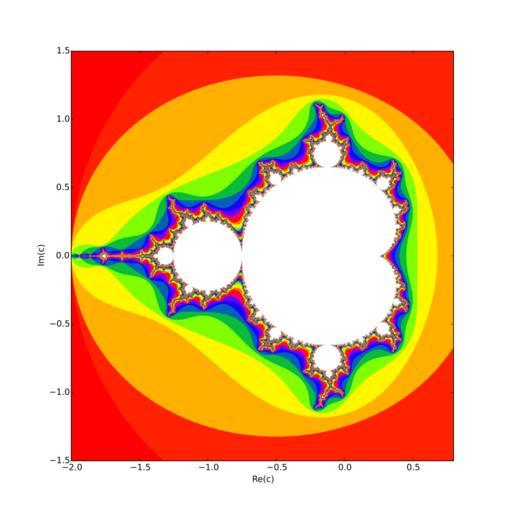
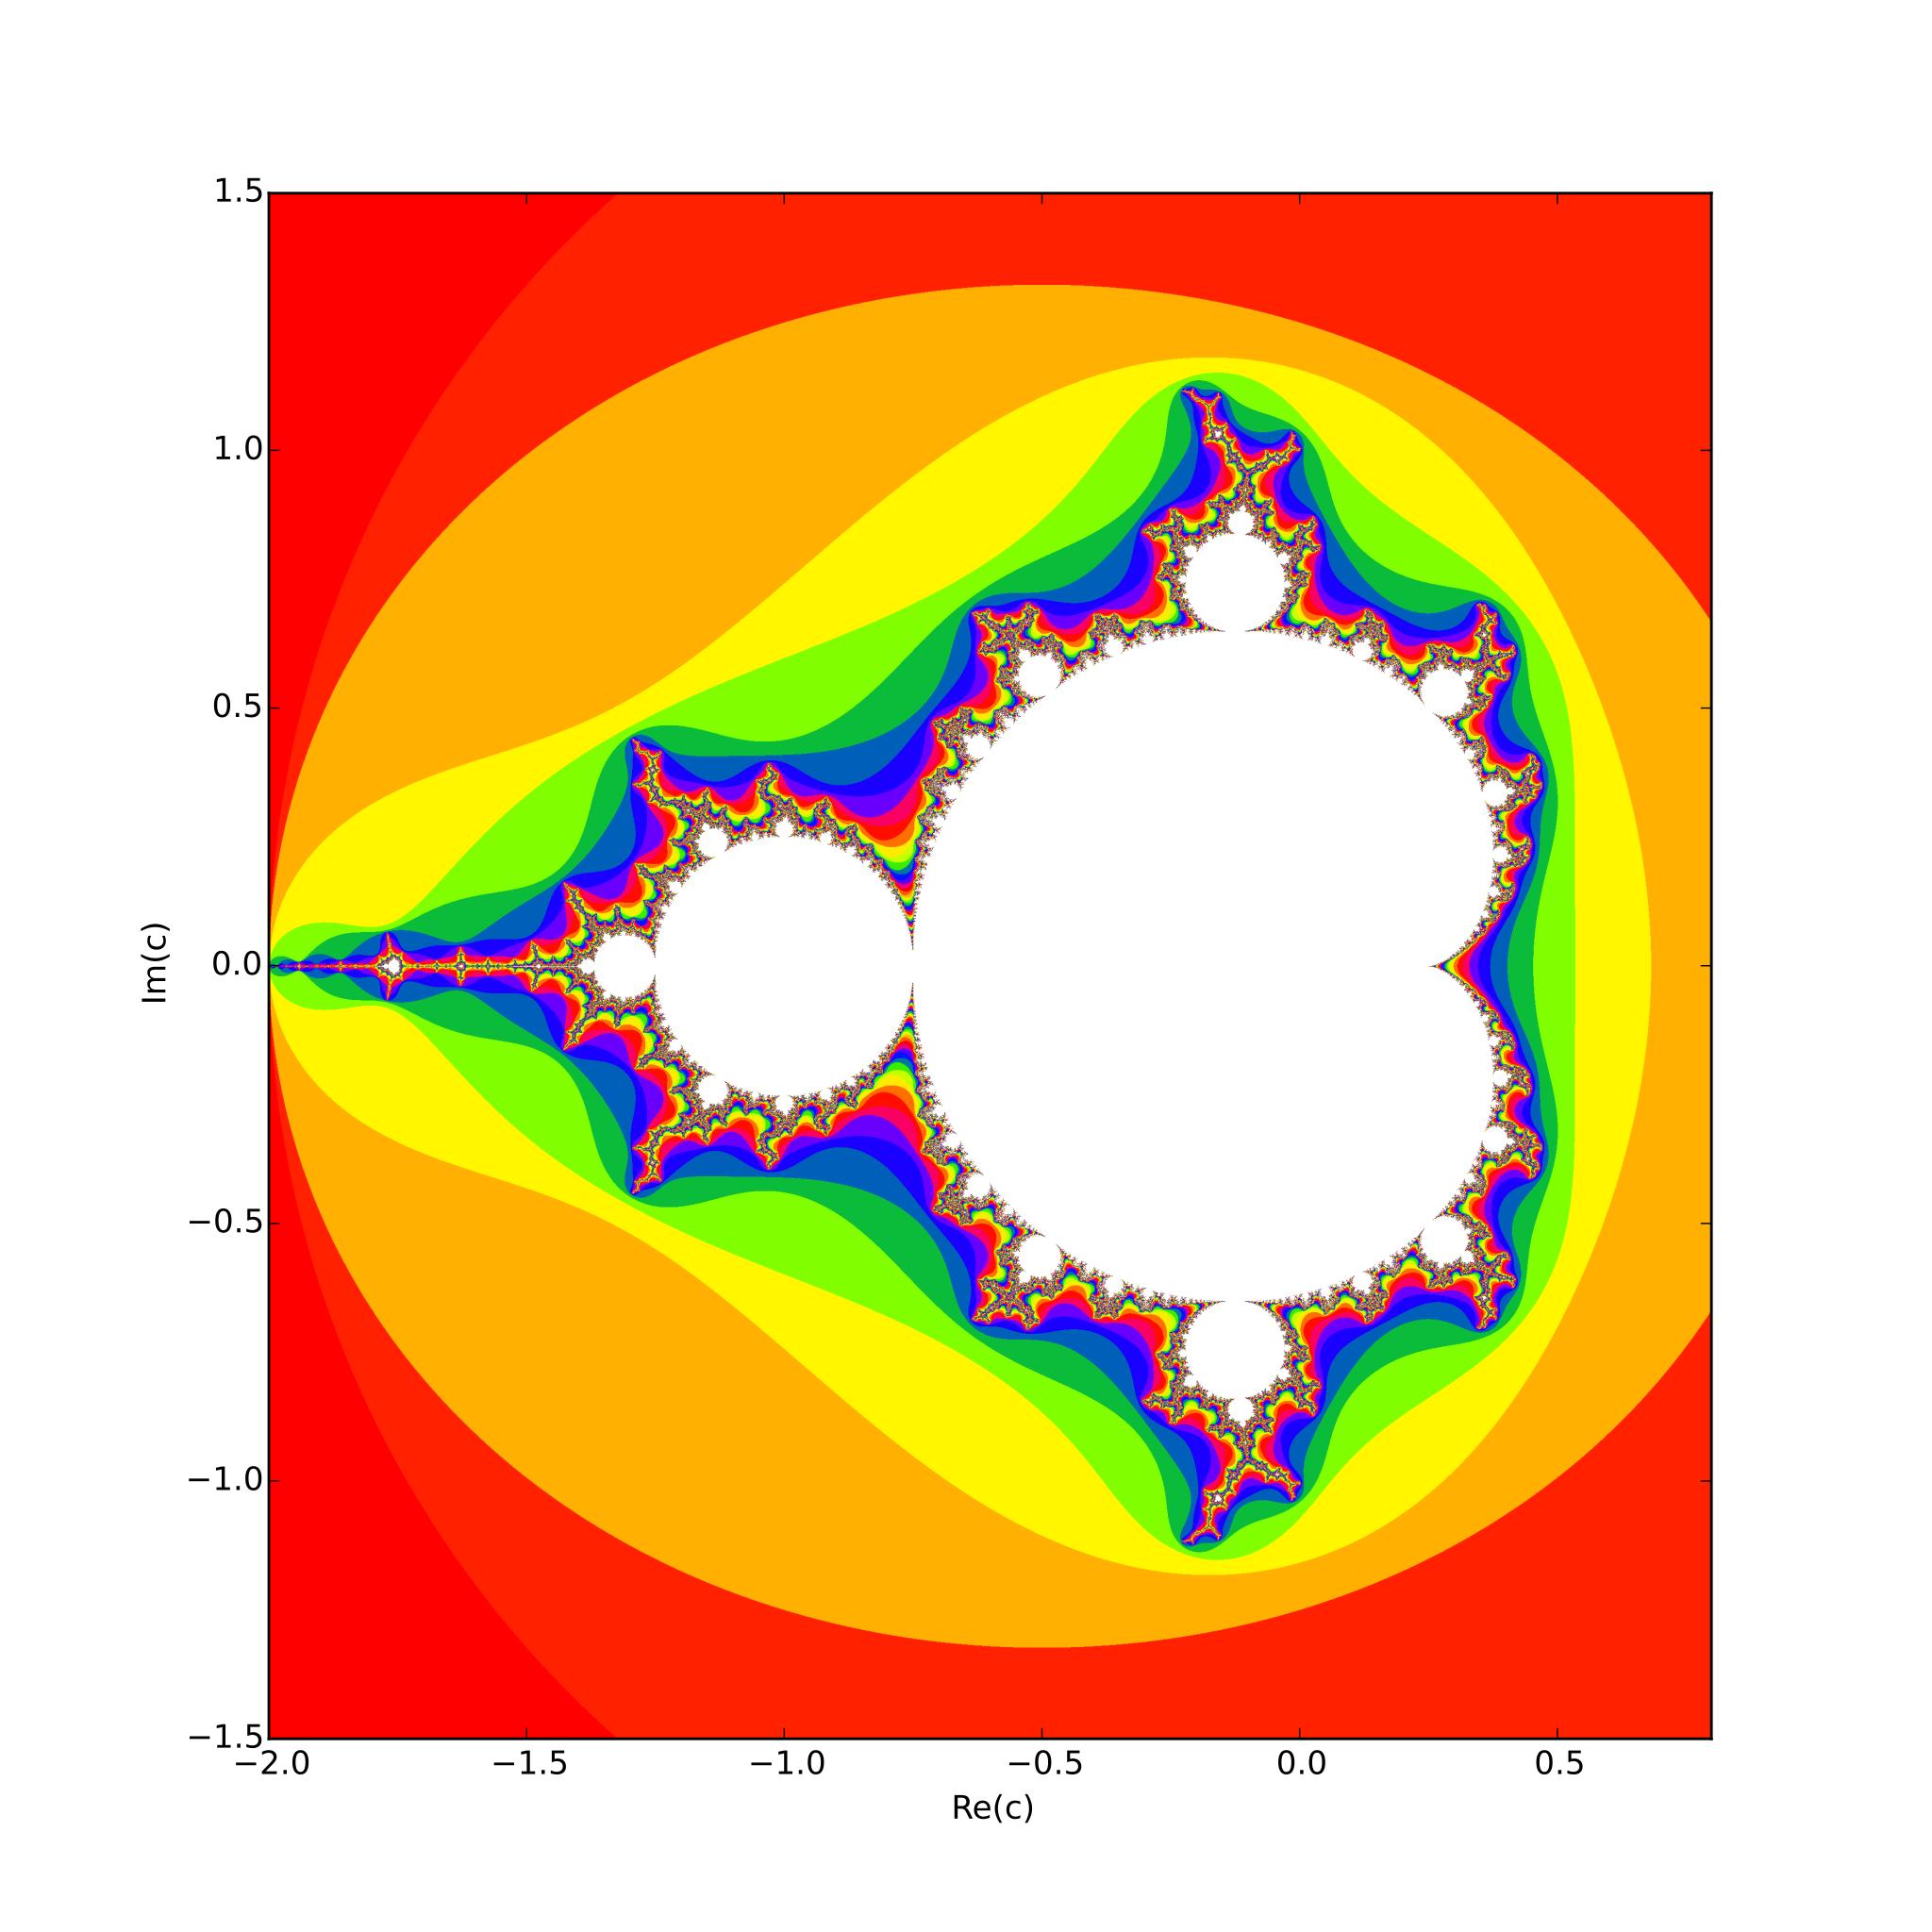
Mandelbrot set plotted with Matplotlib.svg en The Mandelbrot set plotted with Python and Matplotlib Originally programmed for Rosetta Code own Morn Other fields Matplotlib Source code from pylab import from numpy import NaN figure figsize def for in range if abs return return NaN arange arange zeros len len for iy in