
Related Images


Download:
| Tiny | 256x128 | View | Download |
| Small | 512x256 | View | Download |
| Original svg | 650x325 | View | Download |
| Original as jpg | 650x325 | View | Download |
This image was acquired from
wikimedia. It was marked as Public Domain or CC0 and is free to use. To verify, go to the source and check the information there.
Looking for more info about this image?
Try a Google Reverse Image Search for it.
Try a Google Reverse Image Search for it.
Keywords from Image Description:
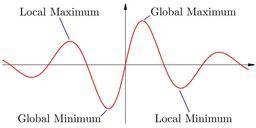
Maxima and Minima.svg diagram showing local and global extrema on the graph of sin left right exp left left frac right right quad pix pi While the are many diagrams of extrema most take functions over an interval In this example the global extrema are the biggest over the entire set of real numbers selfmade Inkscape Inductiveload