Related Images


Download:
| Tiny | 252x128 | View | Download |
| Original svg | 395x200 | View | Download |
| Original as jpg | 395x200 | View | Download |
This image was acquired from
wikimedia. It was marked as Public Domain or CC0 and is free to use. To verify, go to the source and check the information there.
Looking for more info about this image?
Try a Google Reverse Image Search for it.
Try a Google Reverse Image Search for it.
Keywords from Image Description:
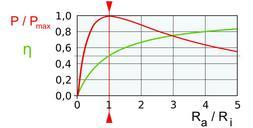
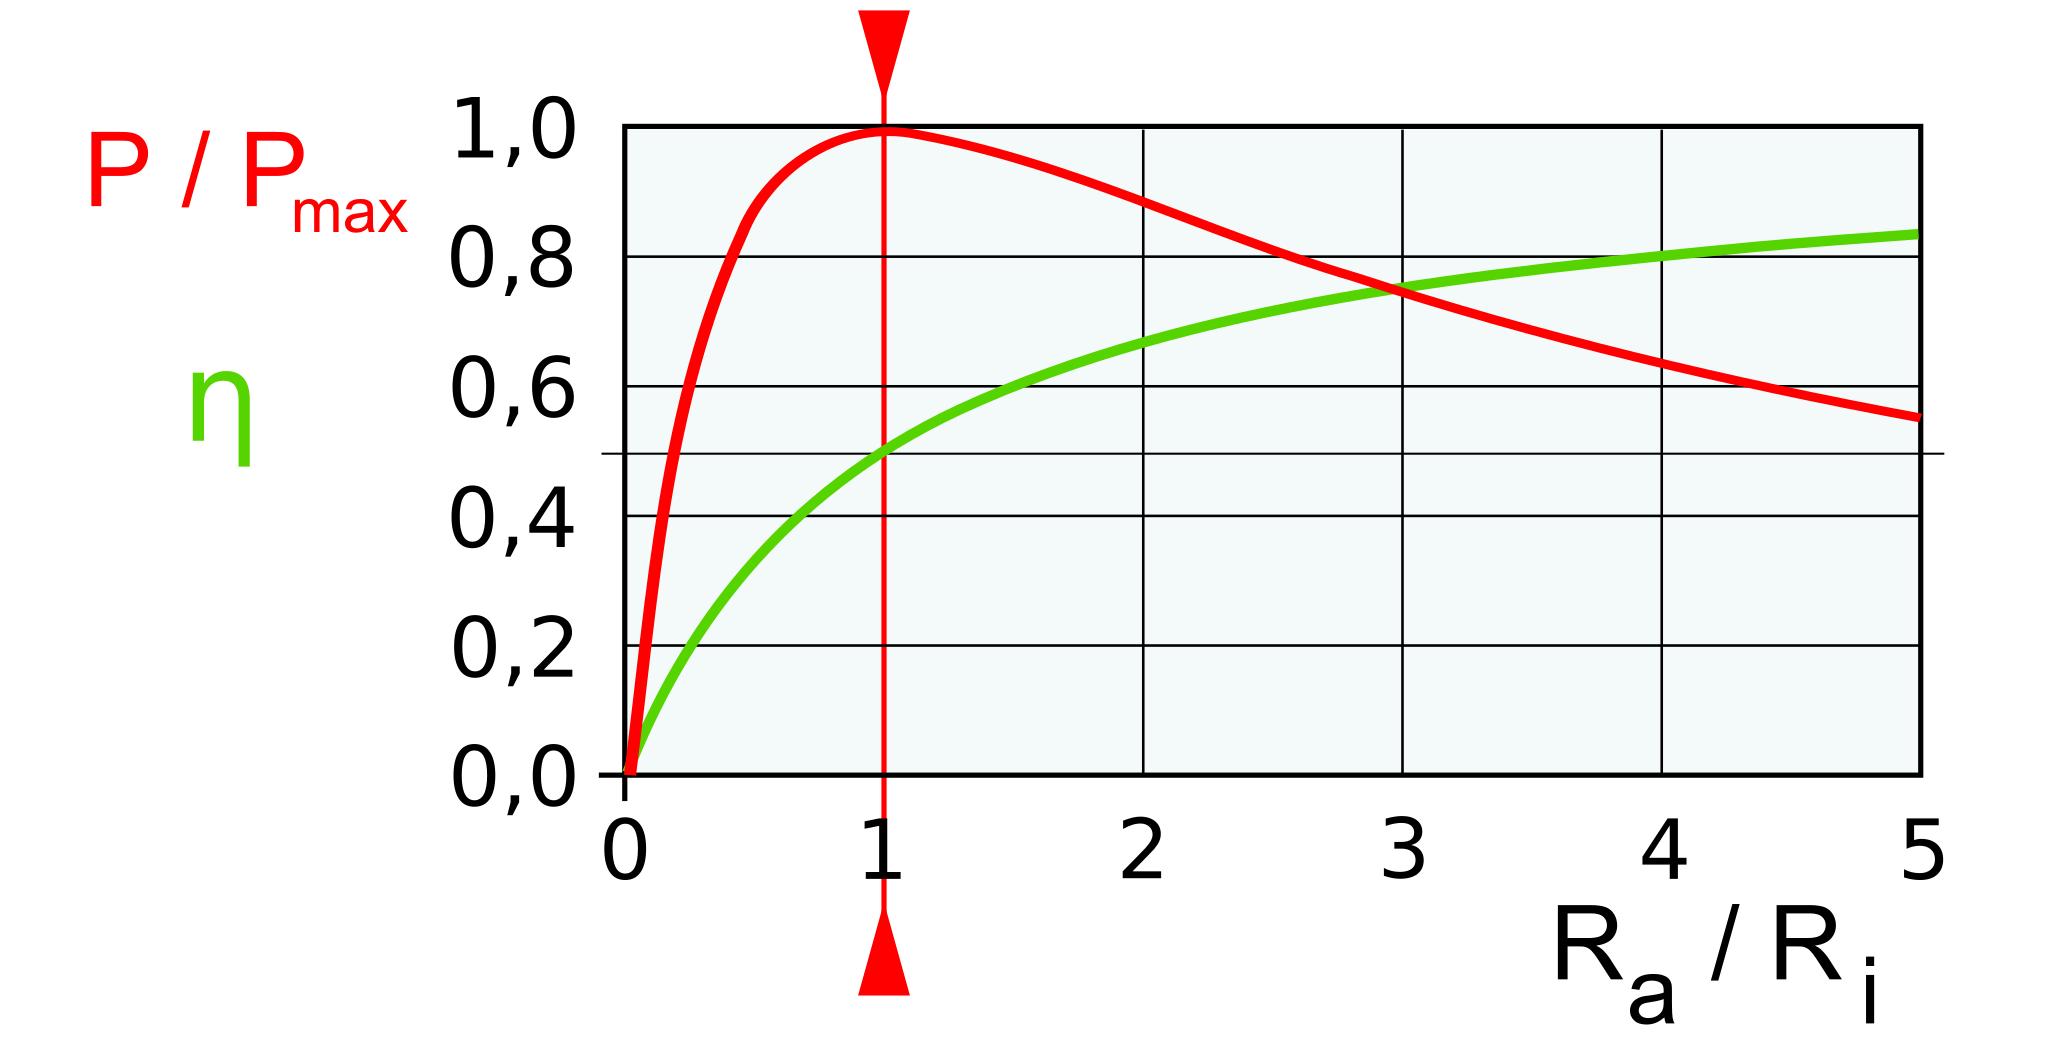
Maximum Power Transfer Graph de.svg graph to show the power dissipated in resistive load red line supplied by source with resistive effects Also shown is the efficiency green line which is the proportion of the total power dissipated that is dissipated in the load resistance MaximumPowerTransferGraph svg UTC MaximumPowerTransferGraph