
Related Images


Download:
| Tiny | 105x128 | View | Download |
| Small | 211x256 | View | Download |
| Medium | 423x512 | View | Download |
| Original | 525x635 | View | Download |
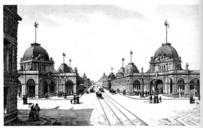
This image was acquired from
wikimedia. It was marked as Public Domain or CC0 and is free to use. To verify, go to the source and check the information there.
Looking for more info about this image?
Try a Google Reverse Image Search for it.
Try a Google Reverse Image Search for it.
Keywords from Image Description:
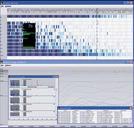
News visualization. en Automated Intelligent Broadcast Video Content Analysis News visualization topics are arranged according to interestingness for given time period Hottest topics those most reported appear in the central column Side columns are used for topics of lesser impact by the interestingness measure multimodal data analysis