
Related Images


Download:
| Tiny | 211x128 | View | Download |
| Small | 422x256 | View | Download |
| Original png | 694x421 | View | Download |
| Original as jpg | 694x421 | View | Download |
This image was acquired from
wikimedia. It was marked as Public Domain or CC0 and is free to use. To verify, go to the source and check the information there.
Looking for more info about this image?
Try a Google Reverse Image Search for it.
Try a Google Reverse Image Search for it.
Keywords from Image Description:
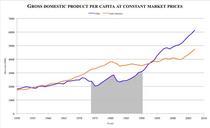
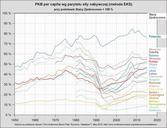
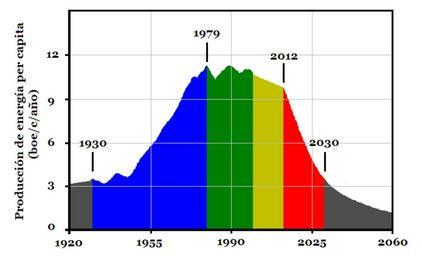
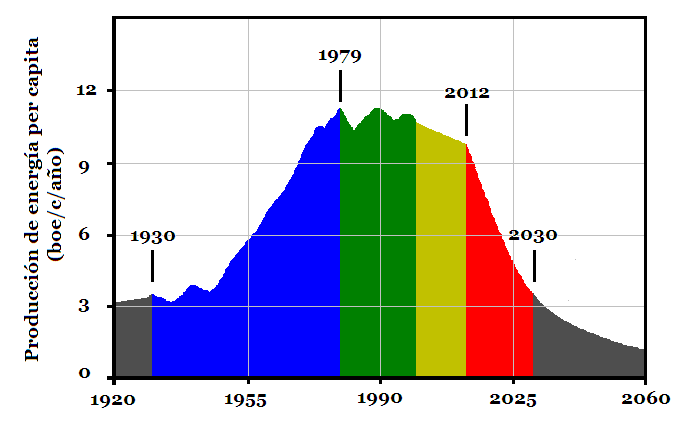
Olduvai per capita. Graphic of year wich shows the energy per capita production following Duncan from to Each color represents stage of the industrial civilisation from to Blue Growthing stage Green and Yellow Stagnation Red Decline with drastic reduction of the energy production from Beyond begins de dark stage es Grfica