
Related Images


This image was acquired from
wikimedia. It was marked as Public Domain or CC0 and is free to use. To verify, go to the source and check the information there.
Looking for more info about this image?
Try a Google Reverse Image Search for it.
Try a Google Reverse Image Search for it.
Keywords from Image Description:
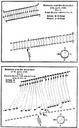
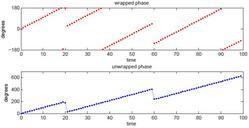
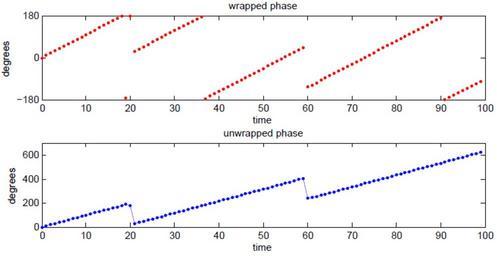
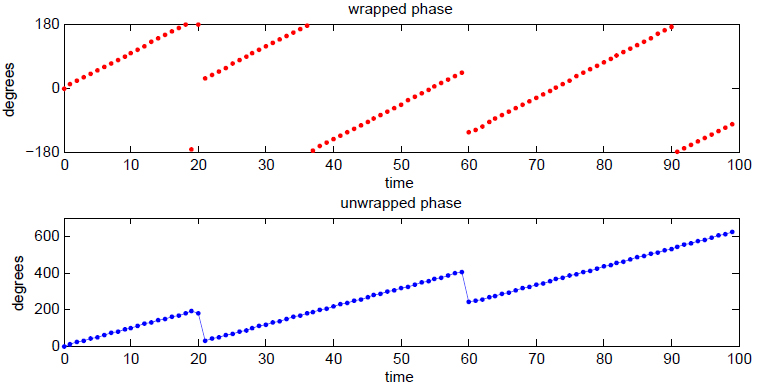
Phase vs Time wrapped and unwrapped. en Illustration of instantaneous phase vs time in two display formats wrapped and unwrapped own Bob graph Matlab commands exp pi exp pi figure subplot plot angle ylim set gca 'YTick' xlabel 'time' ylabel 'degrees' title 'wrapped phase' subplot plot unwrap angle ylim xlabel 'time'