Download:
| Tiny | 164x128 | View | Download |
| Small | 329x256 | View | Download |
| Original png | 536x416 | View | Download |
| Original as jpg | 536x416 | View | Download |
This image was acquired from
wikimedia. It was marked as Public Domain or CC0 and is free to use. To verify, go to the source and check the information there.
Looking for more info about this image?
Try a Google Reverse Image Search for it.
Try a Google Reverse Image Search for it.
Keywords from Image Description:
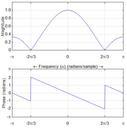
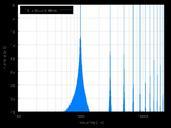
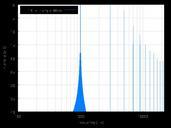
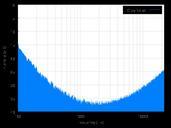
Pmalgorithm. and the xaxis are the various radian frequencies ipspsps All other frequencies listed indicate the extremal frequencies of the frequency response plot As result there are six extremal frequencies and then we add the pass band and stop band frequencies to give total of eight extremal frequencies on the plot own User

