Related Images


Download:
| Tiny | 155x128 | View | Download |
| Small | 311x256 | View | Download |
| Original gif | 359x295 | View | Download |
| Original as jpg | 359x295 | View | Download |
This image was acquired from
wikimedia. It was marked as Public Domain or CC0 and is free to use. To verify, go to the source and check the information there.
Looking for more info about this image?
Try a Google Reverse Image Search for it.
Try a Google Reverse Image Search for it.
Keywords from Image Description:
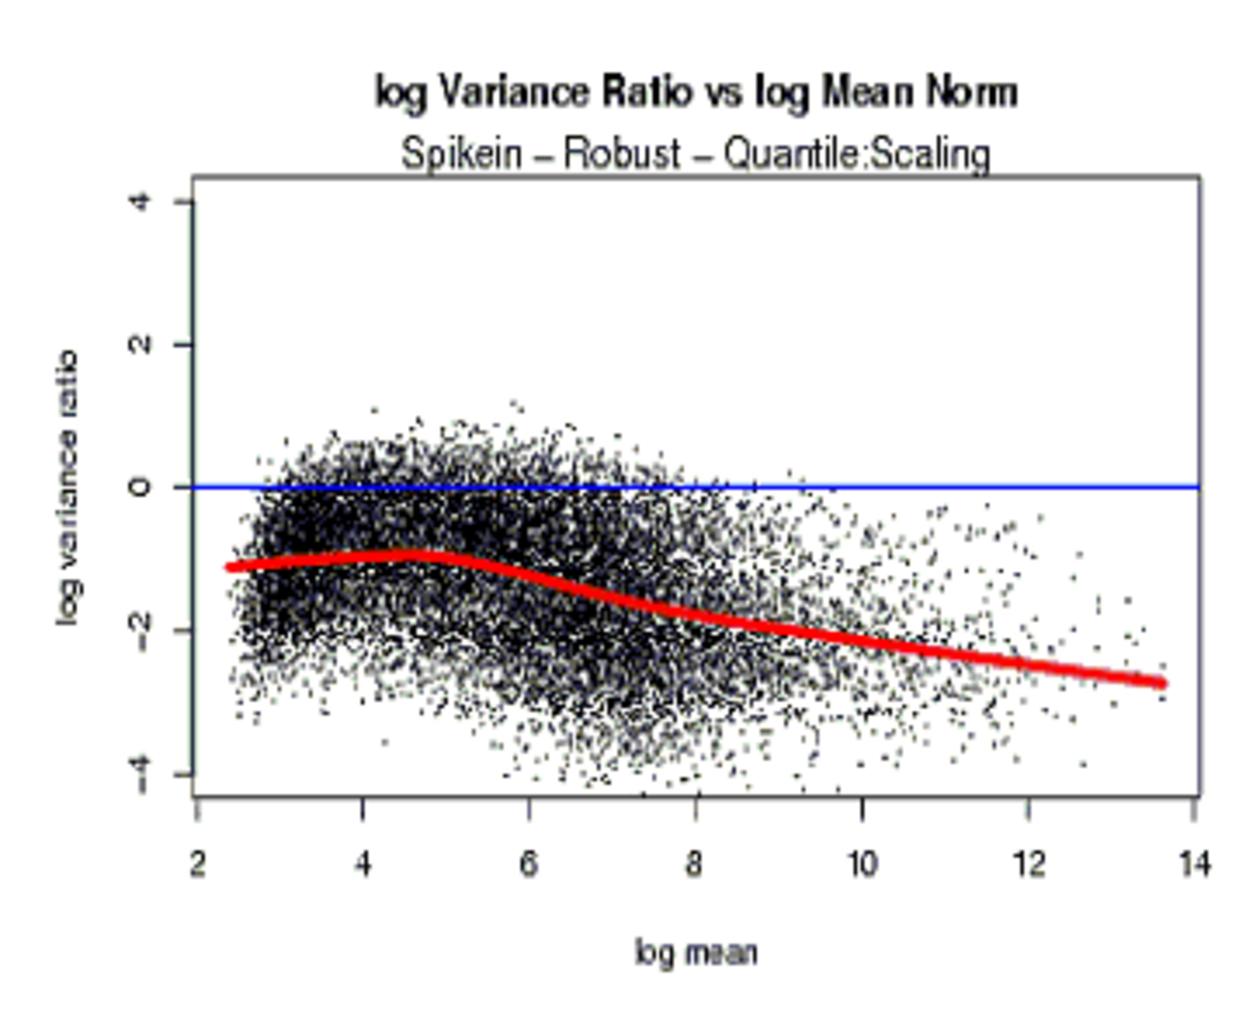
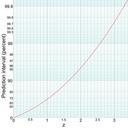
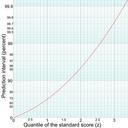
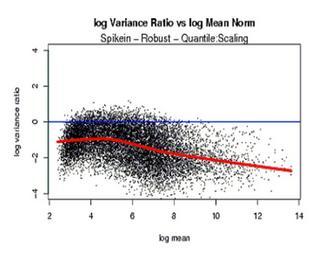
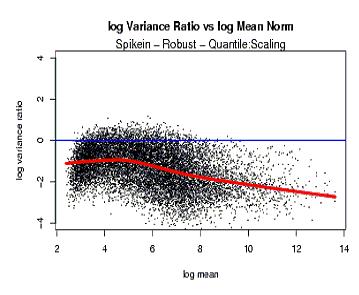
QuantileNormVar. On the yaxis is the ratio of variance across set of replicates after quantile normalisation divided by the variance of the scalenormalized values On the xaxis are the mean levels Both axes are on the log scale nci nih gov Preprocessingfiles PDUSGov original upload log page en QuantileNormVar Psm bytes no