Download:
| Tiny | 128x128 | View | Download |
| Small | 256x256 | View | Download |
| Original png | 382x382 | View | Download |
| Original as jpg | 382x382 | View | Download |
This image was acquired from
wikimedia. It was marked as Public Domain or CC0 and is free to use. To verify, go to the source and check the information there.
Looking for more info about this image?
Try a Google Reverse Image Search for it.
Try a Google Reverse Image Search for it.
Keywords from Image Description:
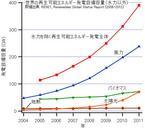
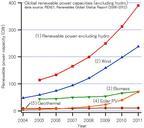
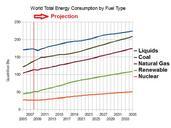
Renewablestimeline. en Logarithmical graph showing exponential growth of usage of wind and solar energy in World installed capacity shown in GW wind dark blue solar yellow geothermal red pl Wykres skali logarytmicznej pokazujcy wykadniczy wzrost wykorzystania energii wiatrowej sonecznej na wiecie latach Zainstalowana moc podana


