Related Images


Download:
| Tiny | 185x128 | View | Download |
| Small | 371x256 | View | Download |
| Medium | 742x512 | View | Download |
| Original png | 841x580 | View | Download |
| Original as jpg | 841x580 | View | Download |
This image was acquired from
wikimedia. It was marked as Public Domain or CC0 and is free to use. To verify, go to the source and check the information there.
Looking for more info about this image?
Try a Google Reverse Image Search for it.
Try a Google Reverse Image Search for it.
Keywords from Image Description:
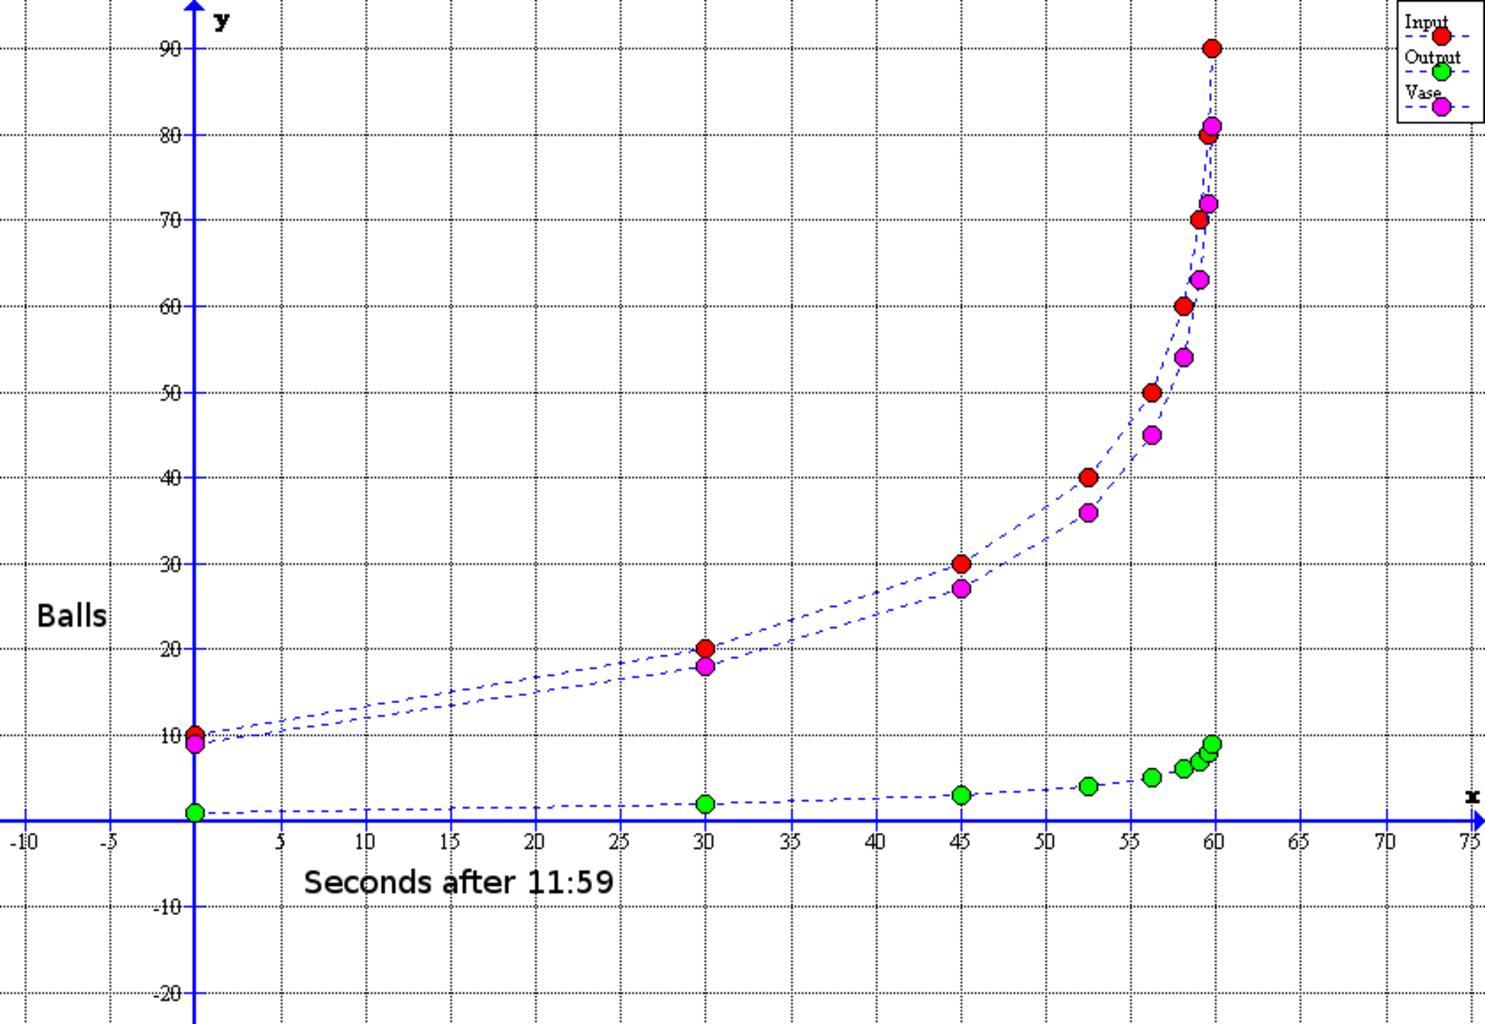
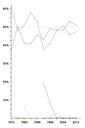
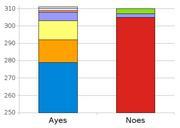
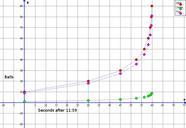
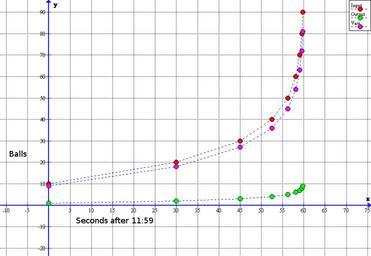
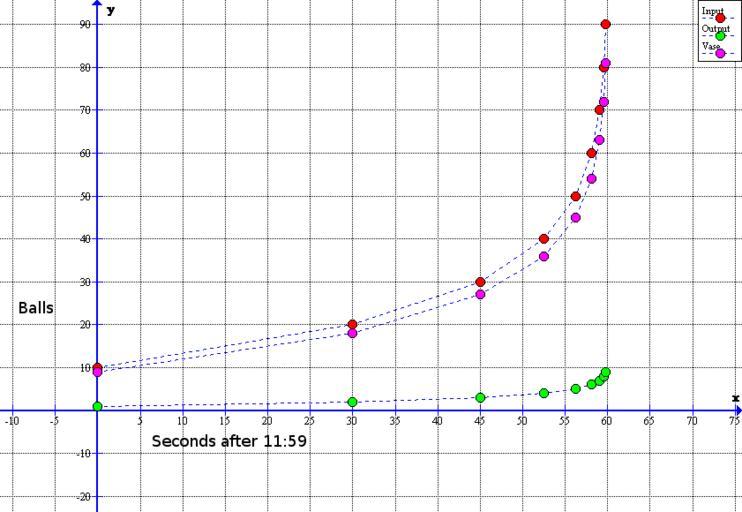
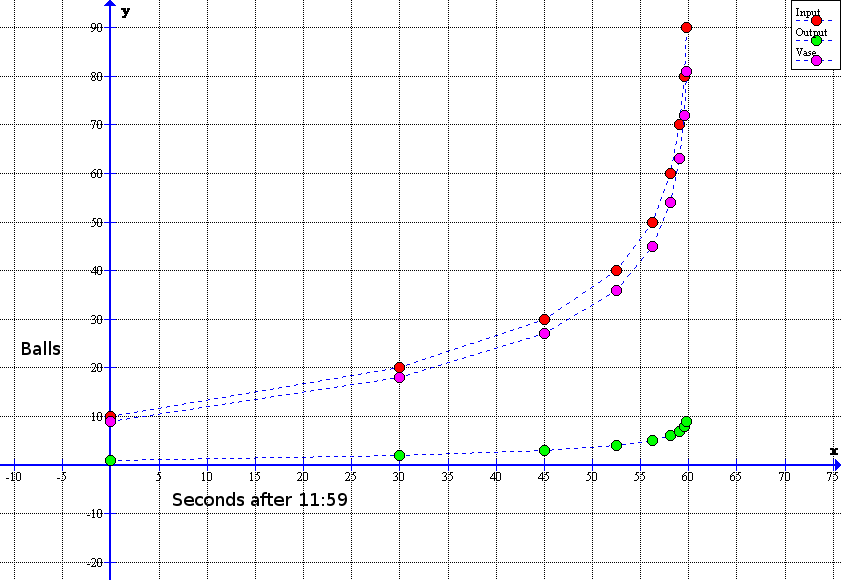
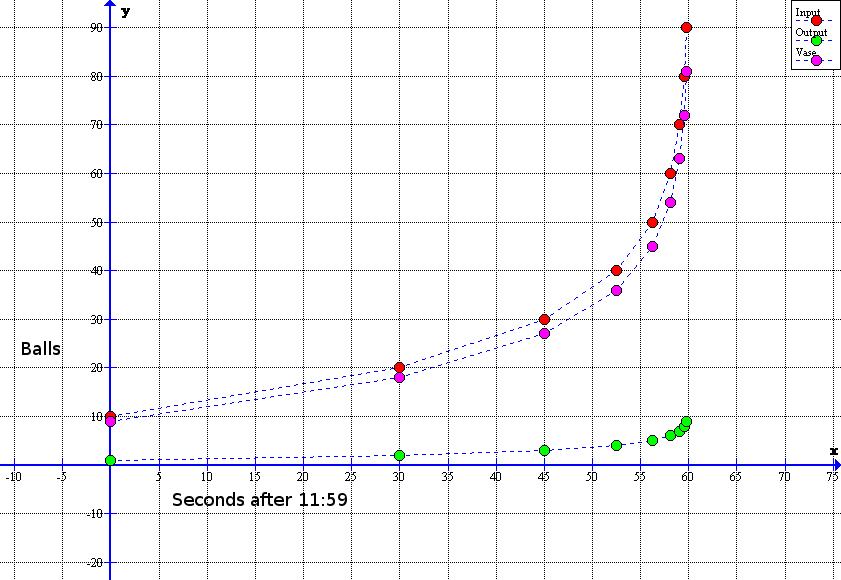
Rosslittlewoodgraph. en graph showing the growth of the number of balls put into remaining in and removed from the vase in the first ten iterations of the RossLittlewood problem with respect to time the oneminute span from to The change in the number of balls for each circumstance is linear with respect to number of iterations