Download:
| Tiny | 181x128 | View | Download |
| Small | 363x256 | View | Download |
| Medium | 726x512 | View | Download |
| Large | 1453x1024 | View | Download |
| Original png | 2000x1409 | View | Download |
| Original as jpg | 2000x1409 | View | Download |
This image was acquired from
wikimedia. It was marked as Public Domain or CC0 and is free to use. To verify, go to the source and check the information there.
Looking for more info about this image?
Try a Google Reverse Image Search for it.
Try a Google Reverse Image Search for it.
Keywords from Image Description:
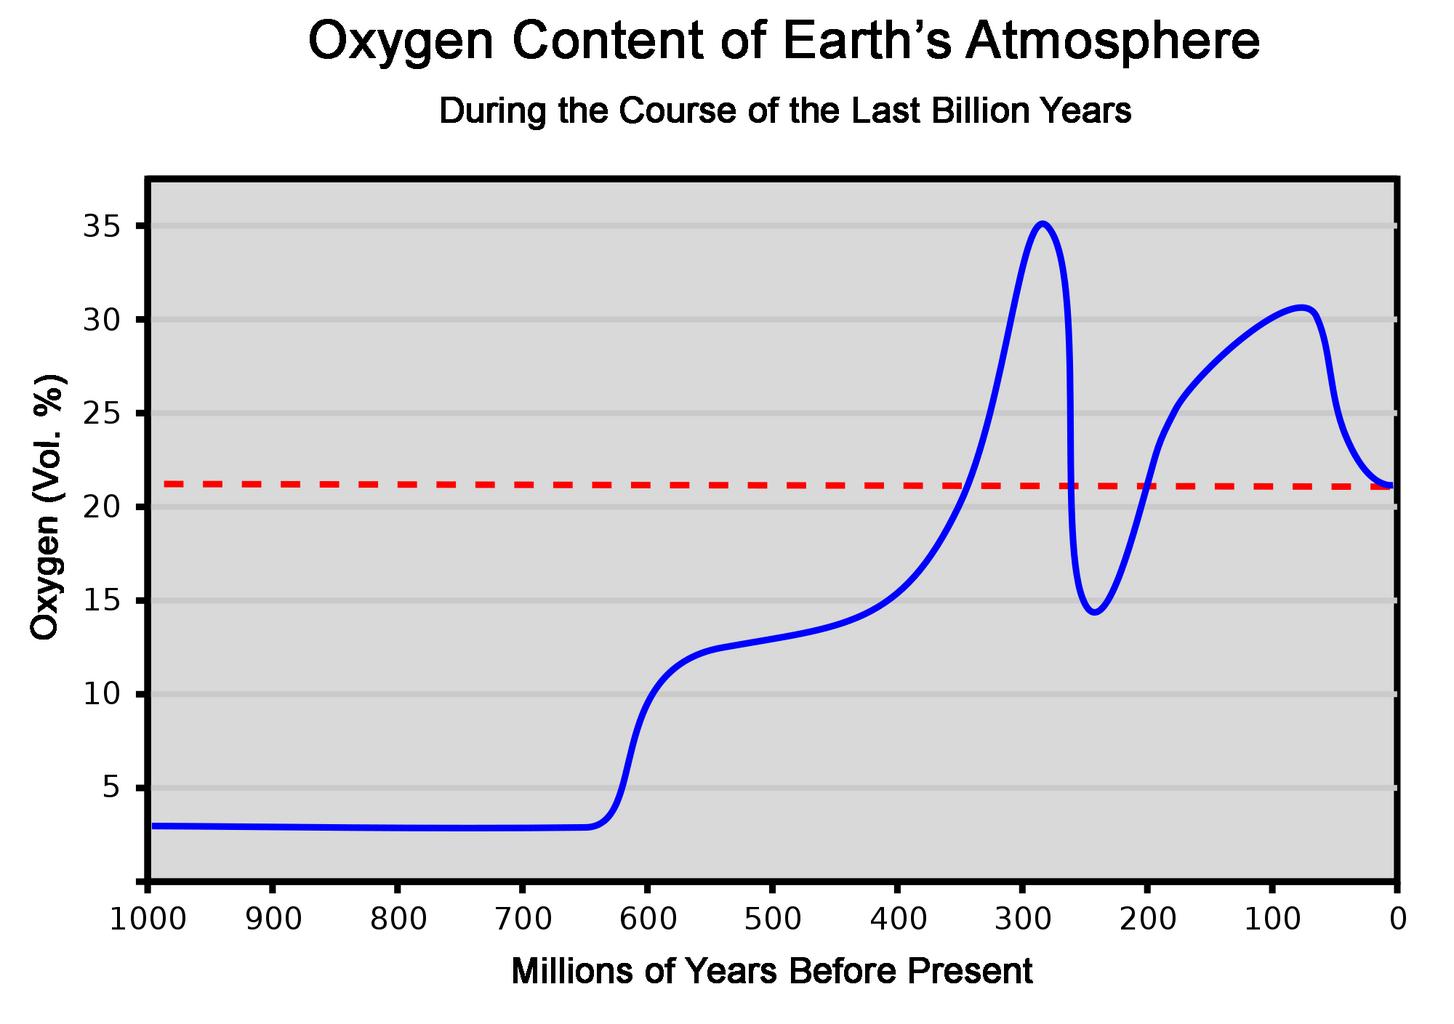
Sauerstoffgehaltmj. This graph represents the concentration of oxygen in the atmosphere over the last million years As reference the dashed red line shows the present concentration of It should be noted that the concentration variation which occurred in past periods can often be estimated only relatively coarsely Therefore the
