
Related Images


This image was acquired from
wikimedia. It was marked as Public Domain or CC0 and is free to use. To verify, go to the source and check the information there.
Looking for more info about this image?
Try a Google Reverse Image Search for it.
Try a Google Reverse Image Search for it.
Keywords from Image Description:
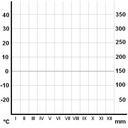
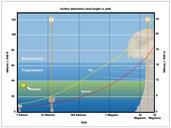
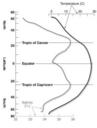
SeaWaterTempSalinitywithDepth. Used various sources as inspiration for the creation of this graph This graph shows the average surface temperature and salinity for the world oceans by latitude As you would expect temperatures are lowest in the polar regions and highest near the equator Heavy rainfall in the equatorial regions freshens