
Related Images


This image was acquired from
wikimedia. It was marked as Public Domain or CC0 and is free to use. To verify, go to the source and check the information there.
Looking for more info about this image?
Try a Google Reverse Image Search for it.
Try a Google Reverse Image Search for it.
Keywords from Image Description:
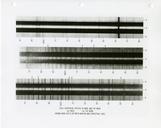
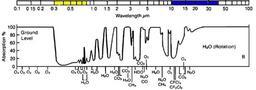
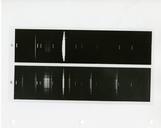
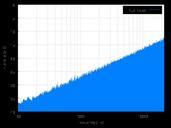
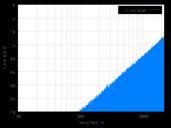
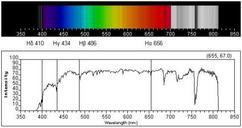
Spectra.ClassicalFunction. Solar spectrum with Fraunhofer lines corresponding intensity vs wavelength plot IR and UV areas are grayedbr Hydrogen Balmer lines are marked as vertical lines br Created with Virtual Spectroscope harvard edu html online version Own Kurgus Solar spectra


