
Related Images


Download:
| Tiny | 170x128 | View | Download |
| Small | 341x256 | View | Download |
| Original png | 560x420 | View | Download |
| Original as jpg | 560x420 | View | Download |
This image was acquired from
wikimedia. It was marked as Public Domain or CC0 and is free to use. To verify, go to the source and check the information there.
Looking for more info about this image?
Try a Google Reverse Image Search for it.
Try a Google Reverse Image Search for it.
Keywords from Image Description:
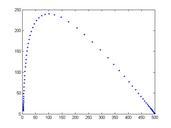
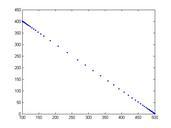
StatespaceSISIS. An epidemiological graph for the SIS model Statespace for represents the number of susceptibles the number of infectious people Graph generated using MATLAB code own assumed Byecommons sirsys program options odeset 'RelTol' 'AbsTol' beta ode sissys options beta plot plot ' ' ' ' function dy sirsys beta dy