Related Images


Download:
| Tiny | 160x128 | View | Download |
| Small | 320x256 | View | Download |
| Medium | 640x512 | View | Download |
| Large | 1280x1024 | View | Download |
| Original svg | 1295x1036 | View | Download |
| Original as jpg | 1295x1036 | View | Download |
This image was acquired from
wikimedia. It was marked as Public Domain or CC0 and is free to use. To verify, go to the source and check the information there.
Looking for more info about this image?
Try a Google Reverse Image Search for it.
Try a Google Reverse Image Search for it.
Keywords from Image Description:
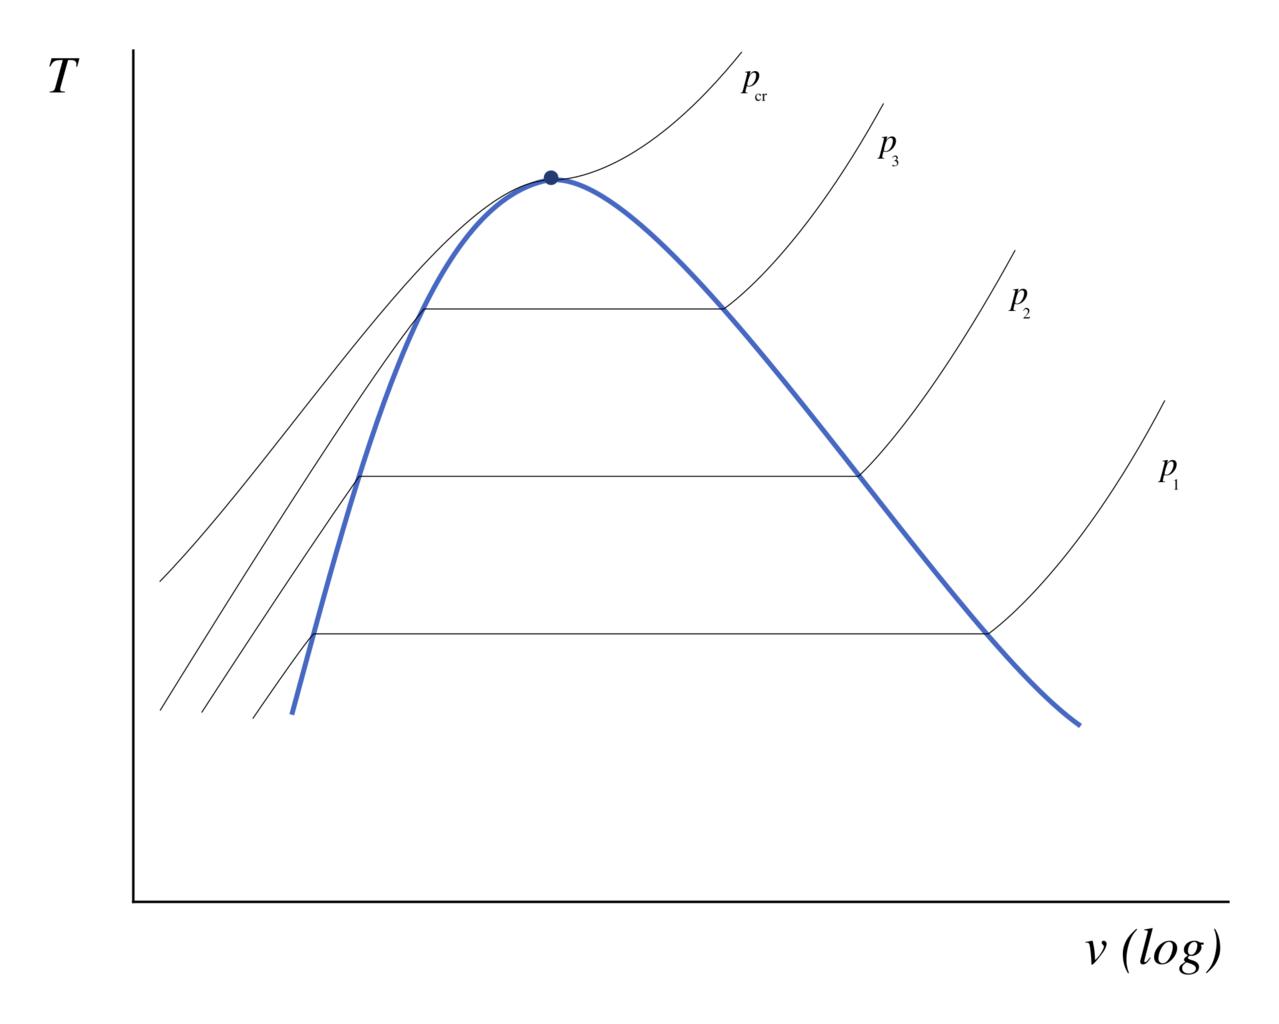
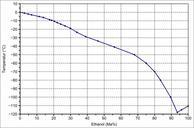
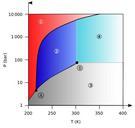
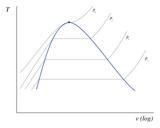
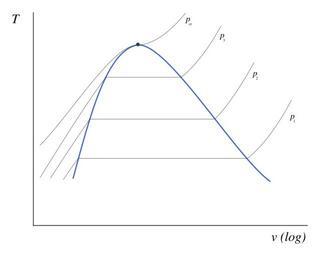
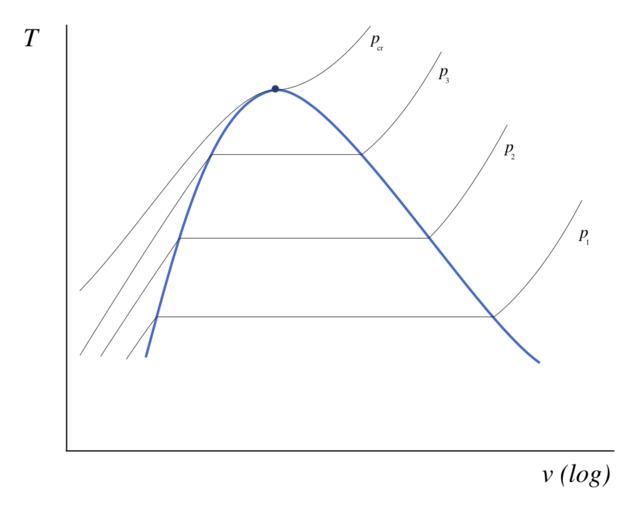
Tv diagram for liquid vapor.svg en Generic representation of temperaturevolume diagram for fluid near its liquid phase transition The blue curve represents the saturation curve black lines are constant pressure isochoric curves own Olivier Cleynen other versions cczero SVG physics Uploaded with Temperaturevolume diagrams