
Related Images


Download:
| Tiny | 170x128 | View | Download |
| Small | 341x256 | View | Download |
| Medium | 682x512 | View | Download |
| Original svg | 800x600 | View | Download |
| Original as jpg | 800x600 | View | Download |
This image was acquired from
wikimedia. It was marked as Public Domain or CC0 and is free to use. To verify, go to the source and check the information there.
Looking for more info about this image?
Try a Google Reverse Image Search for it.
Try a Google Reverse Image Search for it.
Keywords from Image Description:
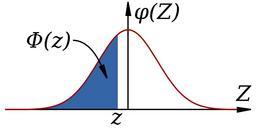
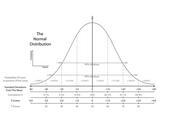
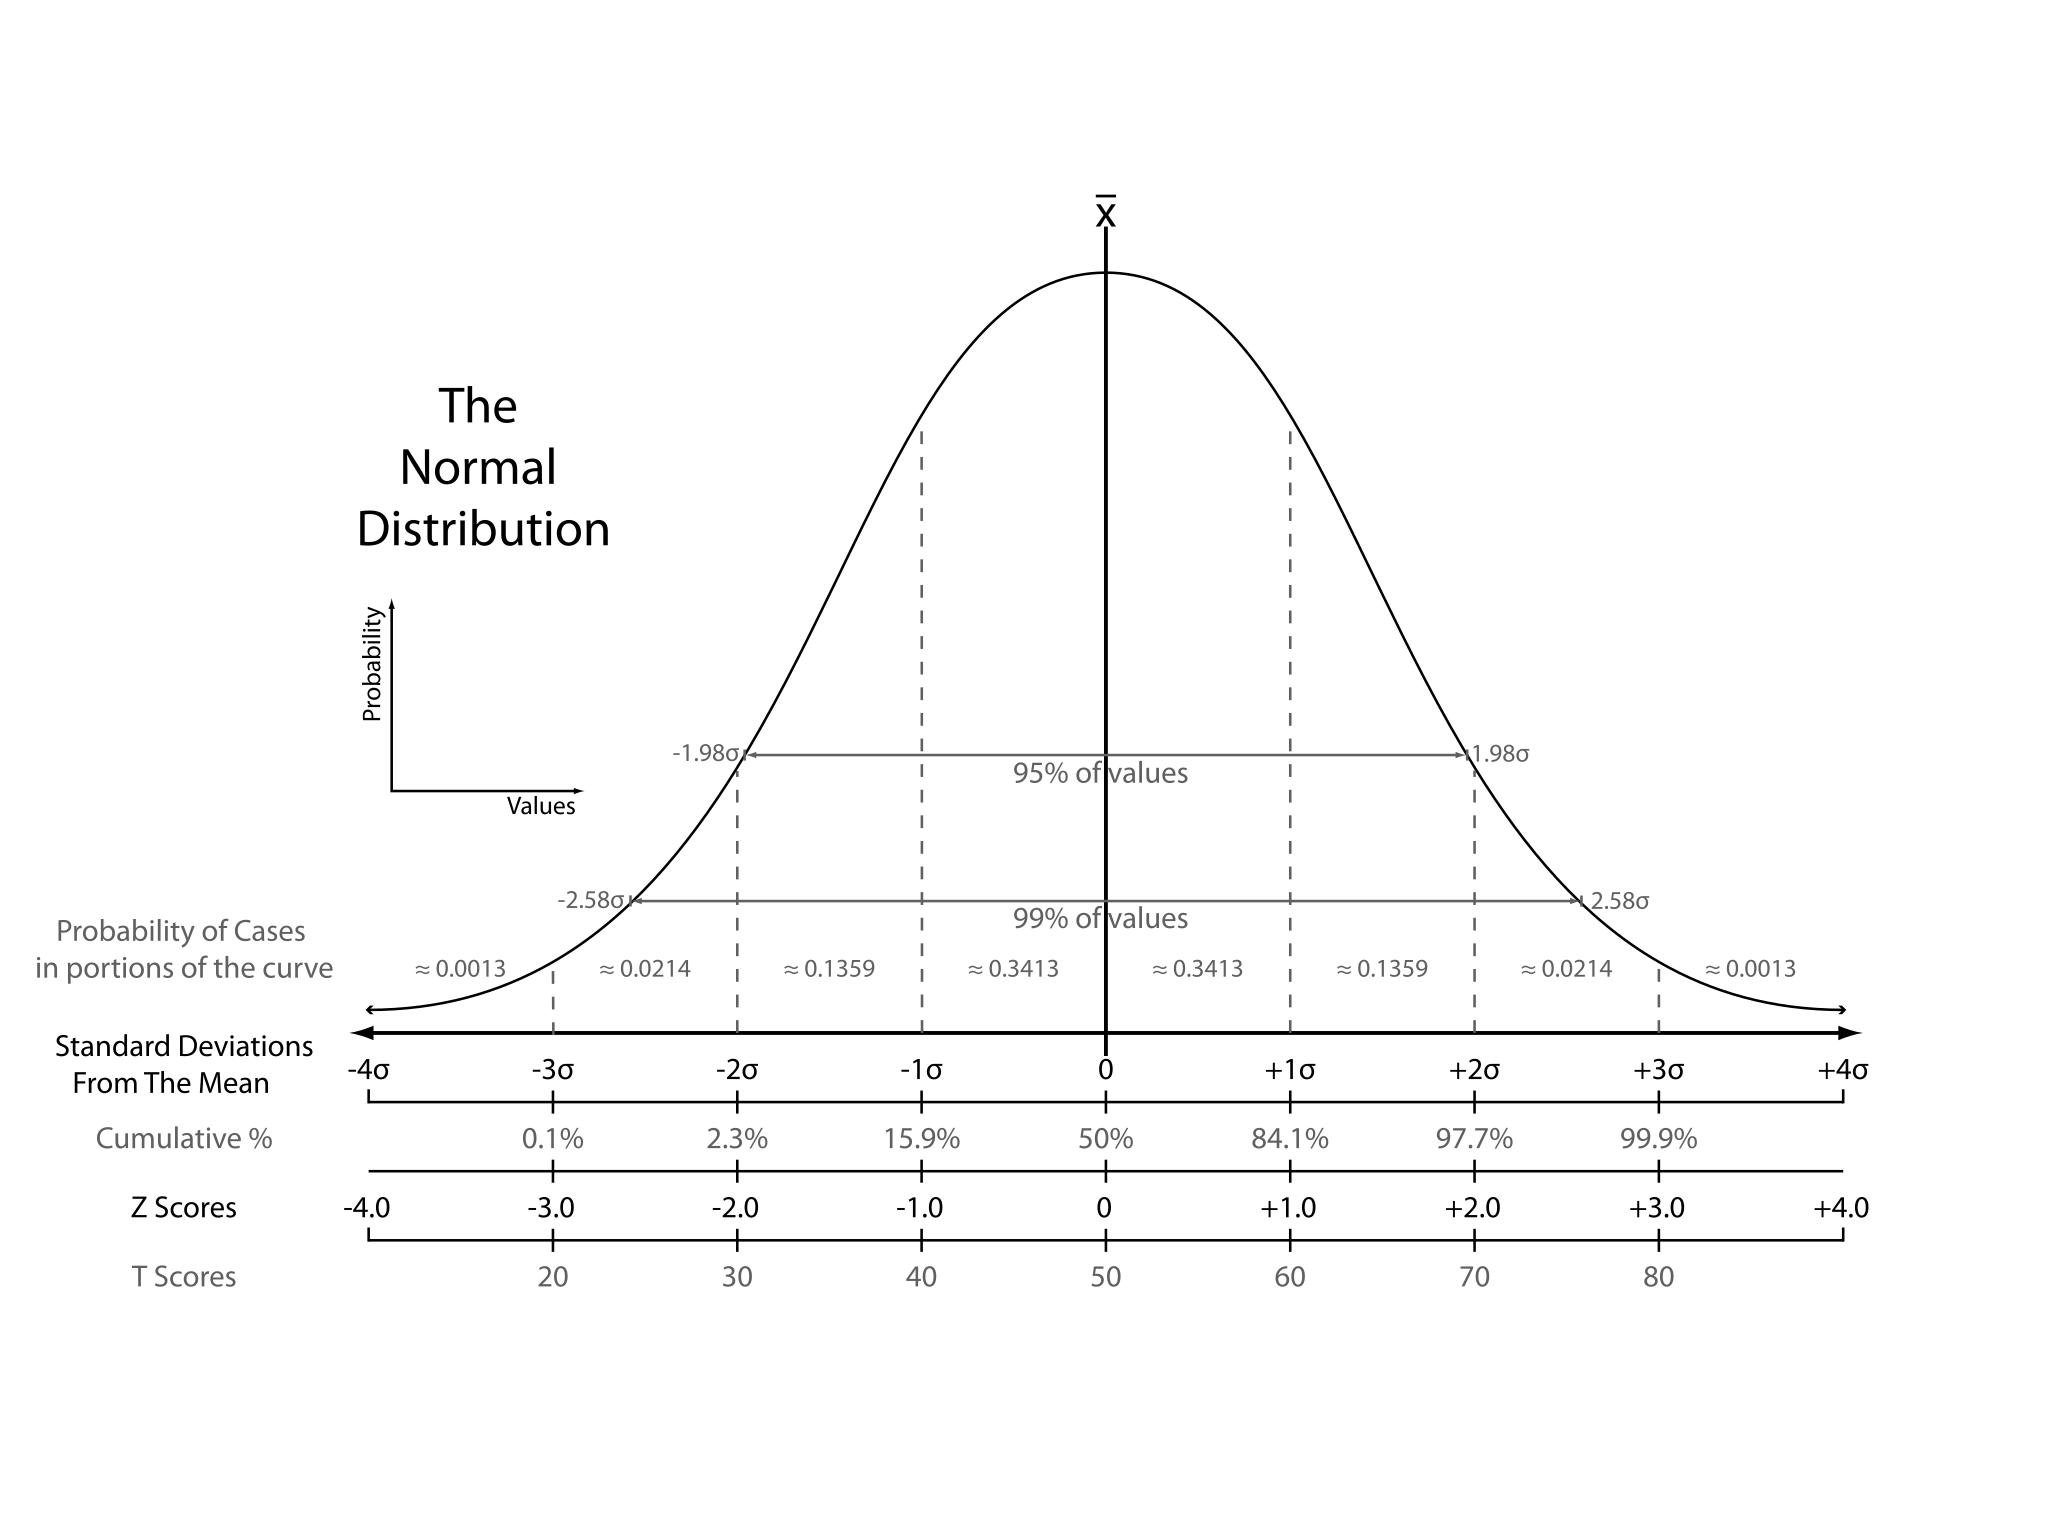
The Normal Distribution.svg The redrawn chart comparing the various grading methods in normal distribution Includes Standard deviations cumulative percentages percentile equivalents Zscores and Tscores Inspired by Figure on Page of Ward MurrayWard Assessment in the Classroom Belmont CA Wadsworth ISBN br Note The range is labelled


