Download:
| Tiny | 162x128 | View | Download |
| Small | 324x256 | View | Download |
| Medium | 649x512 | View | Download |
| Original | 683x538 | View | Download |
This image was acquired from
wikimedia. It was marked as Public Domain or CC0 and is free to use. To verify, go to the source and check the information there.
Looking for more info about this image?
Try a Google Reverse Image Search for it.
Try a Google Reverse Image Search for it.
Keywords from Image Description:
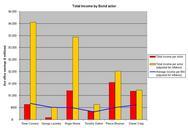
Total income by bond. diagram en This graph is sidebyside comparison of the total gross income generated by different actors in the most widely recognized EON Productions James Bond films The total box office income of all the James Bond films each actor was in is cataloged and beside it is the same figure adjusted for inflation

