
Related Images

Download:
| Tiny | 293x128 | View | Download |
| Small | 587x256 | View | Download |
| Original png | 787x343 | View | Download |
| Original as jpg | 787x343 | View | Download |
This image was acquired from
wikimedia. It was marked as Public Domain or CC0 and is free to use. To verify, go to the source and check the information there.
Looking for more info about this image?
Try a Google Reverse Image Search for it.
Try a Google Reverse Image Search for it.
Keywords from Image Description:
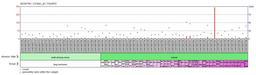
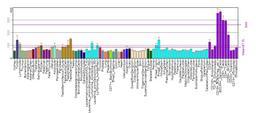
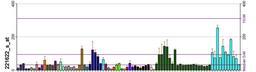
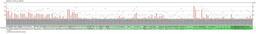
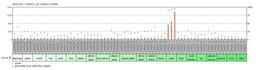
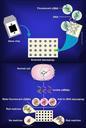
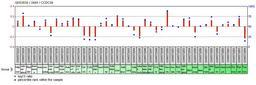
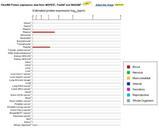
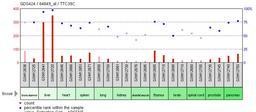
TTCC expression in samples of various human tissues. Uploaded with en wp UW marker This is graph of TTCC expression in samples from different human tissues The bars indicate the quantity of TTCC in the sample and the dots represent the percentile rank of TTCC within each sample ncbi nlm nih gov cgi ID GDS at Affymetrix Inc