Download:
| Tiny | 26x128 | View | Download |
| Small | 53x256 | View | Download |
| Medium | 106x512 | View | Download |
| Large | 212x1024 | View | Download |
| Original png | 418x2011 | View | Download |
| Original as jpg | 418x2011 | View | Download |
This image was acquired from
wikimedia. It was marked as Public Domain or CC0 and is free to use. To verify, go to the source and check the information there.
Looking for more info about this image?
Try a Google Reverse Image Search for it.
Try a Google Reverse Image Search for it.
Keywords from Image Description:
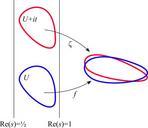
Voronin. The Riemann zetafunction on the strip ComplexGraphf xmin xmax ymin ymax points is the complex function to be graphed in the region xmin xmax ymin ymax The parameter points controls how many points will be sampled in each direction good values are RegionPlotTrue xmin xmax ymin ymax ColorFunction Function HueModArgfx Pi

