
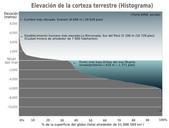
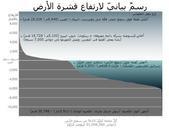
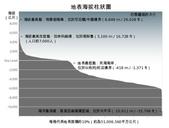
Related Images


Download:
| Tiny | 162x128 | View | Download |
| Small | 324x256 | View | Download |
| Medium | 648x512 | View | Download |
| Original | 695x549 | View | Download |
This image was acquired from
wikimedia. It was marked as Public Domain or CC0 and is free to use. To verify, go to the source and check the information there.
Looking for more info about this image?
Try a Google Reverse Image Search for it.
Try a Google Reverse Image Search for it.
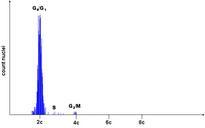
Keywords from Image Description:
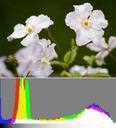
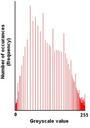
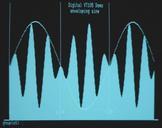
VT histogram. en This image shows an example of shaded graph or histogram created using the VT's waveform graphics mode In this case the second graph has the histogram mode turned on causing it to fill in the area under the curve Because the curve data was stored separately for the two graphs the system could control intensity to