Related Images


Download:
| Tiny | 128x128 | View | Download |
| Small | 256x256 | View | Download |
| Medium | 512x512 | View | Download |
| Original png | 720x720 | View | Download |
| Original as jpg | 720x720 | View | Download |
This image was acquired from
wikimedia. It was marked as Public Domain or CC0 and is free to use. To verify, go to the source and check the information there.
Looking for more info about this image?
Try a Google Reverse Image Search for it.
Try a Google Reverse Image Search for it.
Keywords from Image Description:
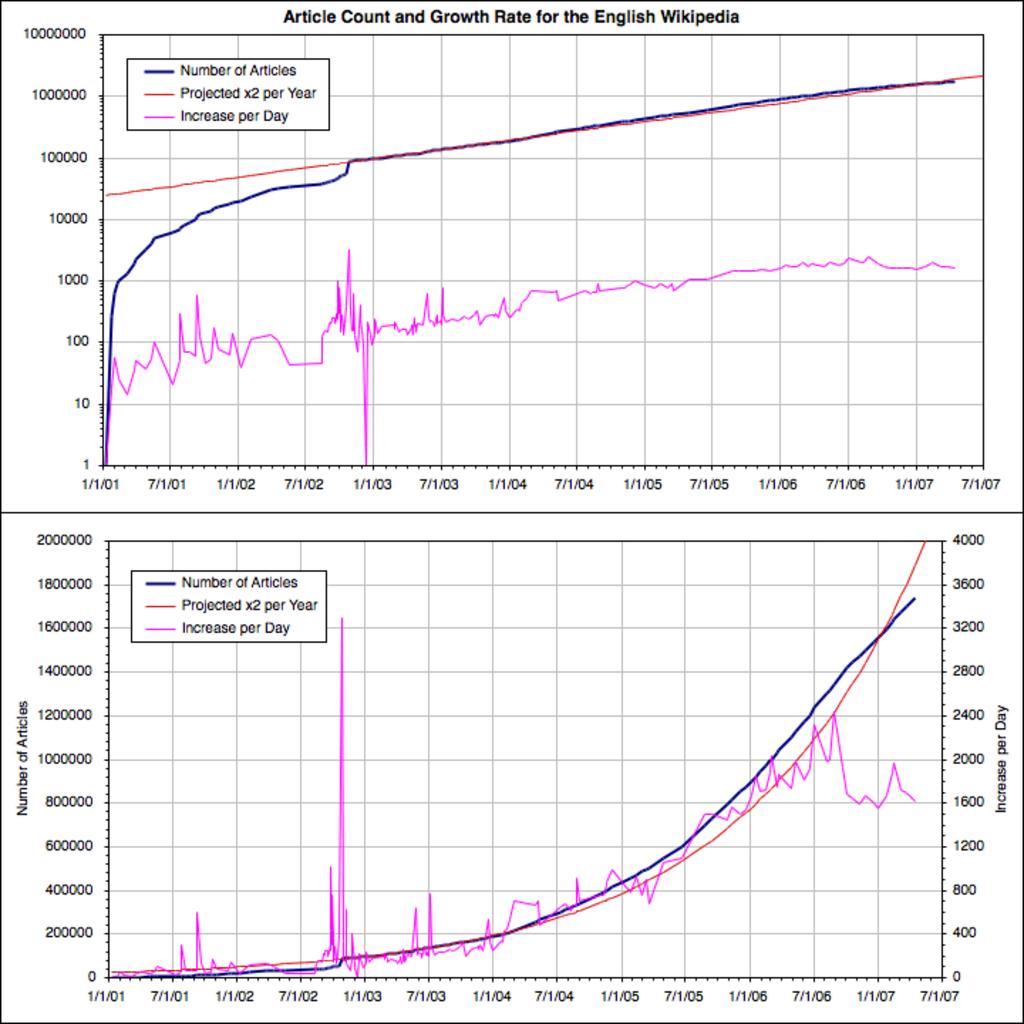
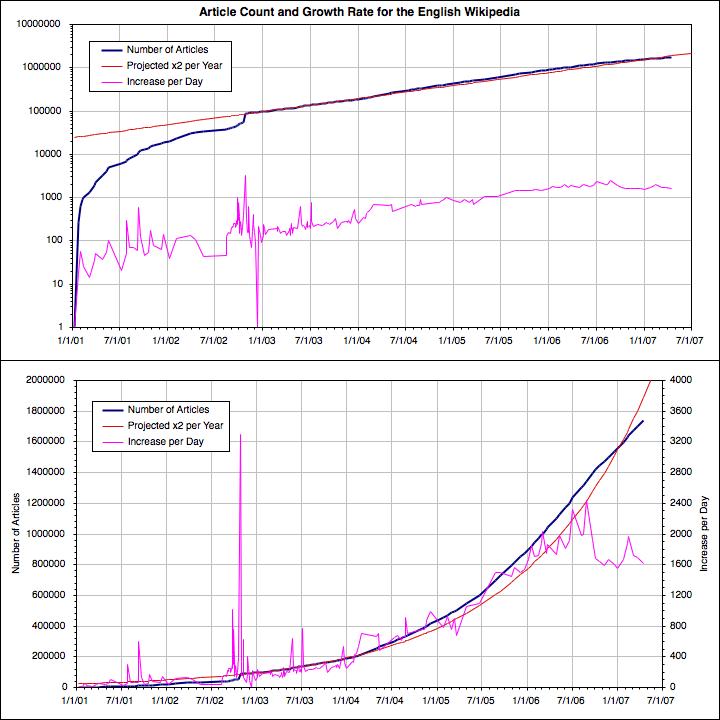
Graphs of the article count for the English from January to April Two graphs are included using both logarithmic and linear yaxes The graphs also show the approximate rate of article increase per day along with the projected number of articles based on annual doubling referenced to January Own work based on data from Size