
Related Images


Download:
| Tiny | 135x128 | View | Download |
| Small | 271x256 | View | Download |
| Medium | 542x512 | View | Download |
| Original | 975x921 | View | Download |
This image was acquired from
wikimedia. It was marked as Public Domain or CC0 and is free to use. To verify, go to the source and check the information there.
Looking for more info about this image?
Try a Google Reverse Image Search for it.
Try a Google Reverse Image Search for it.
Keywords from Image Description:
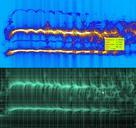
Winger ville vs FIR Bank sonogram. en comparison of timefrequency distribution plotted using Wigner Ville in yellow analysed with Sonogram and FIR Filter Bank in Green programmed by Antony Stewart own Lifeinthetrees Antony Stewart CC by Antony Stewart Cczero Uncategorized May